Ultimate Guide to Monitoring & Logging on AWS EKS: Prometheus, Grafana, Loki, and Promtail
Installation and configuration of Prometheus Operator, Grafana, Loki, and Promtail to ensure seamless application performance and effective log management. Learn to create custom metrics, set up alerting mechanisms, and visualize data through the Grafana dashboard monitoring solution


🙋♂️ Introduction
Hello everyone, I'm Ankit Jodhani, a DevOps engineer passionate about Cloud and Container technologies. This blog is part of the #10weeksofcloudops series initiated by Piyush Sachdeva.
📚 Synopsis
In this blog, we will implement monitoring and logging from scratch on an AWS EKS cluster using open-source tools like Prometheus, Grafana, Loki, and Promtail. We will also discuss writing custom metrics in a Node.js application, making them scrappable by Prometheus, setting up Alertmanager to receive email alerts, and designing custom dashboards in Grafana.
Once the monitoring part is over, we will move on to logging. We will set up Promtail and Loki to collect and aggregate logs, and finally visualize our logs using Grafana dashboards.
🔸 Story
- Run Terraform scripts to create an EKS Cluster with necessary components.
- Instrumentation: Understand prom-client to write custom metrics in a Node.js app and dockerize it.
- Deploy the app on Kubernetes and make it accessible over the internet.
- Install Prometheus Operator and Grafana on the EKS Cluster.
- Configure Alerting rules, Service Monitors, and AlertManager for email alerts.
- Create dashboards in Grafana to visualize the performance of the cluster and application.
- Install Loki on the EKS Cluster and configure it with AWS S3 for log storage.
- Install Promtail on the EKS Cluster and configure it to send logs to Loki.
- Configure Grafana to display application logs.
- Clean up all the infrastructure.
✅ Prerequisites
- 📌 AWS Account
- 📌 Basic knowledge of Terraform
- 📌 Basic knowledge of Docker
- 📌 Basic of Nodejs (Good to have)
🖥️ Local setup
📦 List of AWS services
- 👑 Amazon EKS
- 🌐 Amazon VPC
- 🔒 Amazon IAM
- 💻 Amazon EC2
- ⚖️ Amazon Autoscaling
- 🪣Amazon S3
- 🚀 DynamoDB
☸️ List of Kubernetes Tools & Drivers
- 📂 EBS CSI Driver (EKS Addon)
- 📊 Helm charts
- 🧑🏭 Prometheus Operator (using kube-prometheus-stack helm chart)
- 🔔 Alertmanager (using kube-prometheus-stack helm chart)
- 💻 Grafana (using kube-prometheus-stack helm chart)
- 🗃️ Loki (using grafana helm chart)
- 🔎 Promtail (using grafana helm chart)
☸️ Monitoring
- Monitoring involves tracking the performance of your application and resources, and sending alerts when something is running slowly or failing, to prevent issues from escalating.
📊 Prometheus
- It is an open-source monitoring tool that tracks your workload and stores all your metrics in a time-series database.
- We use PromQL to query the metrics
- In this blog, we'll store data inside an AWS EBS volume.
📢 Alert manager
- Alert Manager is a Prometheus component responsible for sending alerts to users.
📘 Logging
- Logging helps you see what's happening inside your cluster, nodes, and how your application behaves in response to different requests and components, aiding in troubleshooting errors or bugs.
📜Promtail
- Promtail is an open-source tool created by Grafana Labs. It collects all container logs and sends them to Loki.
🔗 Loki
- Loki is also an open-source tool designed and developed by Grafana Labs. It consumes data sent by Promtail or other tools, processes, and filters it.
- We use LogQL to query the logs from loki.
- Loki can be integrated with many cloud services, in this blog we'll use the AWS S3 bucket to store the logs.
🖥️ Grafana
- Grafana is a visualization tool commonly used for monitoring and logging.
- Grafana can be integrated with prometheus, loki many other tool to create beautiful dashboard.
- Grafana will query the prometheus & loki to get the metrics and logs.
🎯 Architecture
Let's understand the architecture of the project. Understanding the architecture makes it easier to proceed with the practical steps.
- As you can see in the architecture, Prometheus scrapes metrics from the application and cluster and stores them in AWS EBS Volumes to keep it persistent in case of pod failure. just like that Grafana & Alermanger will also store its data inside EBS Volume.
- Promtail will collect all the logs from the nodes (application logs + component logs) and send those logs to Loki.
- Loki will aggregate & process the logs and send them to the AWS S3 bucket.
- Grafana will query Prometheus and Loki for metrics and logs.
🚀 Step-by-Step Guide
💻 Clone the repository
- Please clone the Github repository on your local computer.
git clone https://github.com/AnkitJodhani/eks-monitoring-and-logging.git

cd eks-monitoring-and-logging
- Below you can see the directory structures and purpose of each directory
📂eks-private-container-registry
├──📁app-code
│   └── (Code of nodejs application)
├──📁app-k8s-manifest
│   └── (Contents of kubernetes manifest files for nodejs app)
├──📁eks-terraform
│   └── (Contains Terraform script to create AWS EKS cluster)
├──📁grafana-dashboard
│   └── (Contains json file for grafana dashboard )
├──📁kube-prometheus-stack
│   └── (Kubernetes manifest file for prometheus operator)
├──📁loki-promtail-stack
│   └── (Contents of Loki & Promtail)
├──😺.gitignore
├──📄readme.md
└──📄test.sh
🧑💻 Instrumentation
- Instrumentation is the process of making code changes in the application to write custom metrics & expose metrics.
- Instrumentation helps in Monitoring Performance + gaining insight of the application
- I already created a demo nodejs app to demonstrate the Instrumentation. you will find the code inside
app-codedirectory. - Please read
index.jsfile. here I'll share a brief overview of the code- Express Setup: Initializes an Express application and sets up logging with Morgan.
- Logging with Pino: Defines a custom logging function using Pino for structured logging.
- Prometheus Metrics with prom-client: Integrates Prometheus for monitoring HTTP requests using the
prom-clientlibrary:http_requests_totalcounterhttp_request_duration_secondshistogramhttp_request_duration_summary_secondssummarynode_gauge_examplegauge for tracking async task duration
- Basic Routes:
/: Returns a "Running" status./healthy: Returns the health status of the server./serverError: Simulates a 500 Internal Server Error./notFound: Simulates a 404 Not Found error./logs: Generates logs using the custom logging function./crash: Simulates a server crash by exiting the process./example: Tracks async task duration with a gauge./metrics: Exposes Prometheus metrics endpoint.
- After adding the required metrics, Dockerize the application and push it to the container registry. In my case, I pushed it to the docker hub.
👑 EKS Cluster using Terraform
- Now, let's go ahead and spin up the EKS Cluster.
cd eks-terraform/main
- in this directory, you will find all the config files for Terraform like
backend.tfterraform.tfvarsetc.. and you can modify them based on your requirements but the default setting will work fine for this project. - Initialize the terraform
terraform init
- validate the script
terraform validate
- See the plan of what Terraform going to install for us
terraform plan
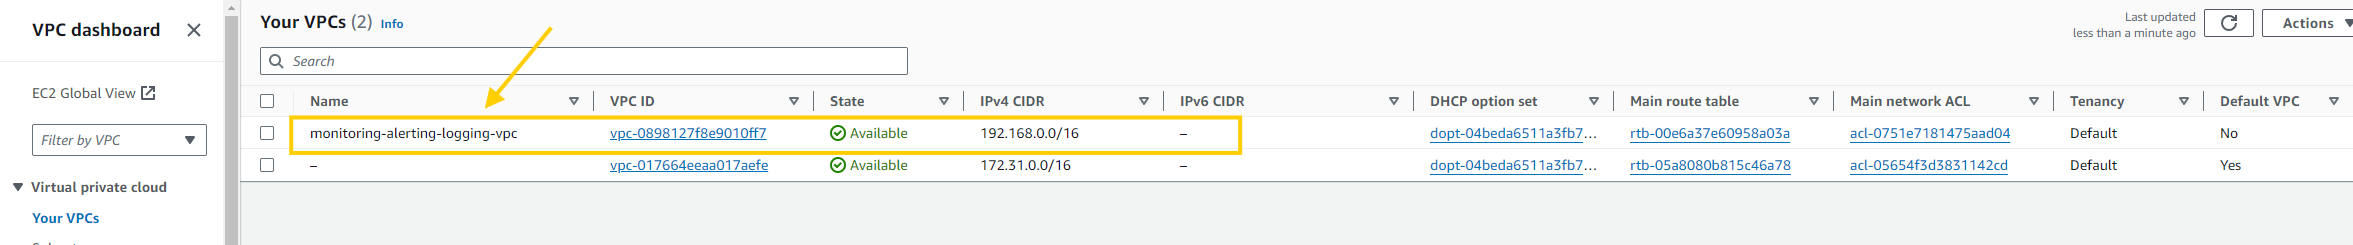
- VPC, IAM Roles, EKS Cluster + Managed NodeGroup, EBS CSI driver (using AWS Addon) + IRSA (IAM role for service account)
- Now, let's execute the terraform to create the AWS EKS Cluster
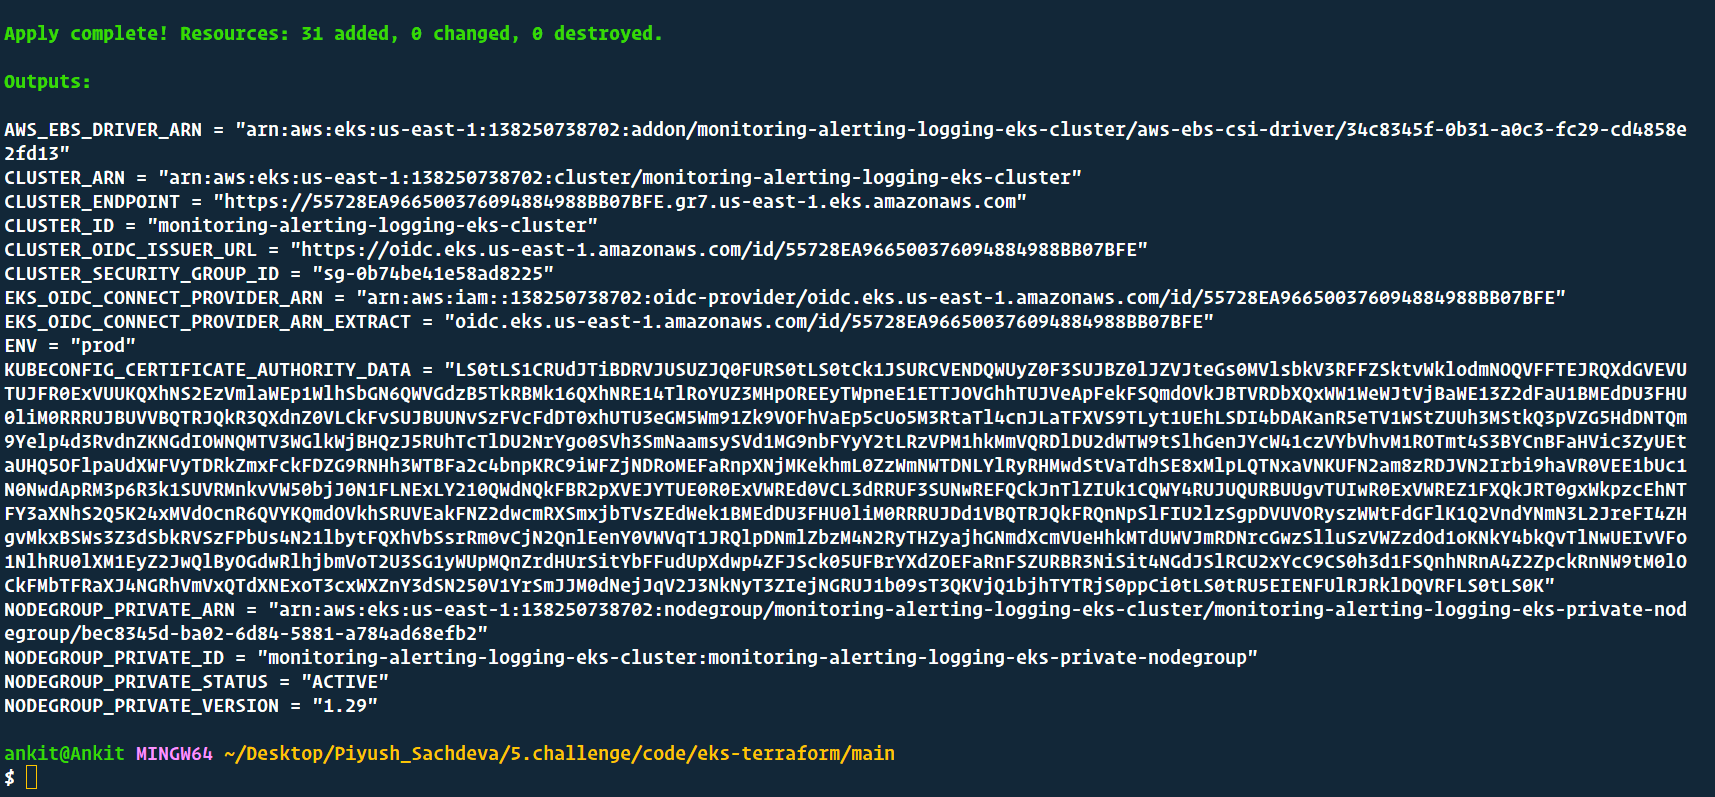
terraform apply --auto-approve
Once, the above command completes its execution successfully, you have will have eks cluster running. let's head over to the aws console to verify that.
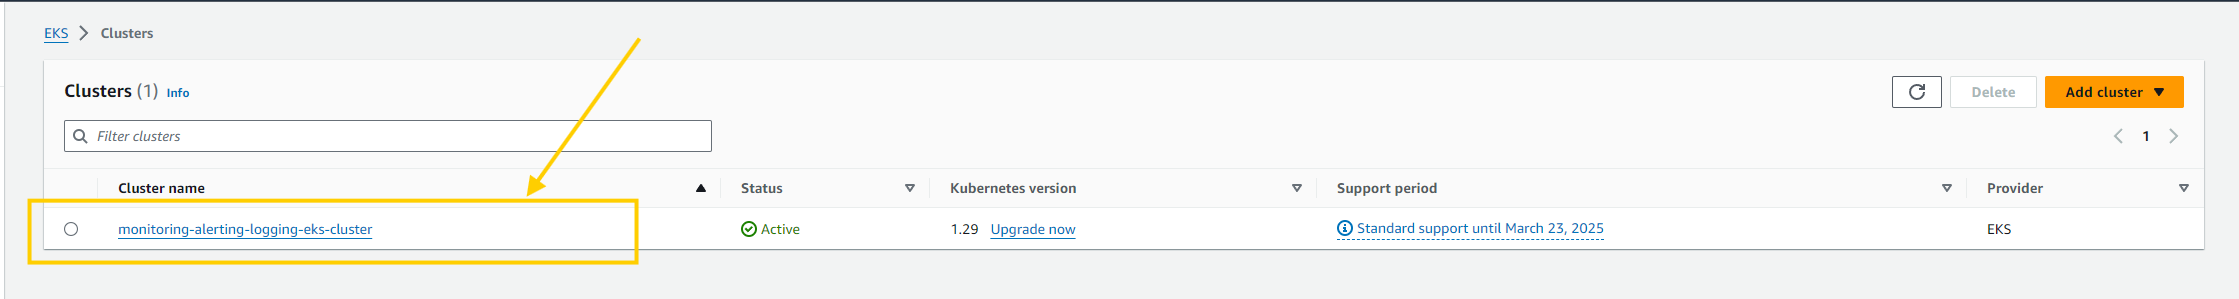
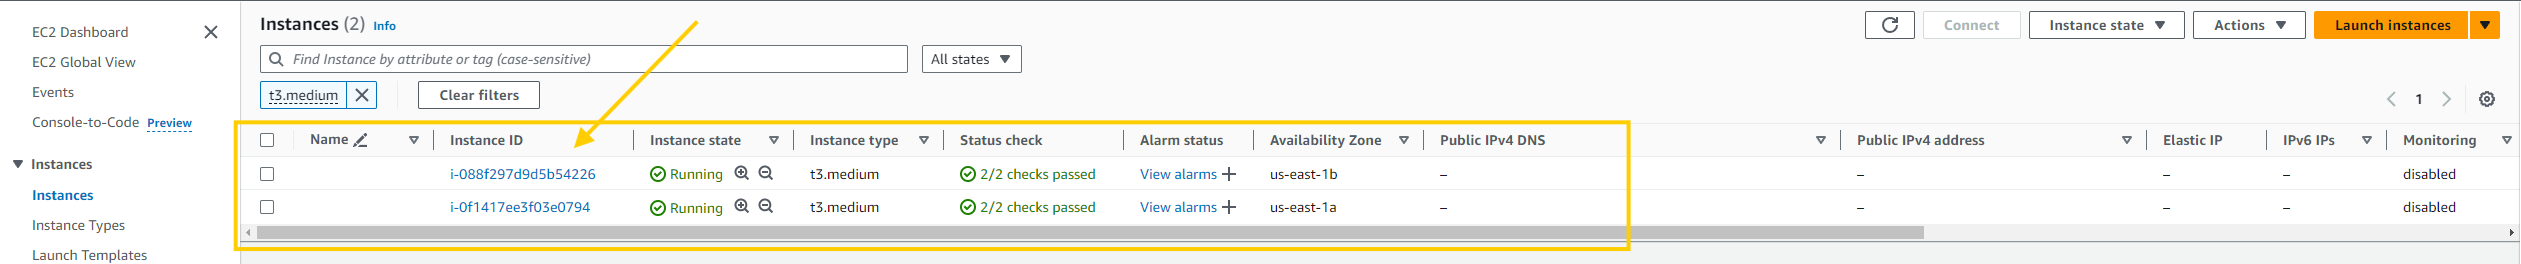
AWS EKS Cluster using Terraform
- Let's update the
.kube/configfile to connect with the cluster
aws list-clusters --region us-east-1

aws eks update-kubeconfig --name monitoring-alerting-logging-eks-cluster --region us-east-1
- Now, we can review the K8s component
kubectl get all -n kube-system
🧑🚀 Deploy Nodejs app
- Our EKS Cluster is running, and now we can deploy our node js application.
- You will find the Kubernetes manifest file in
app-k8s-manifestdirectory. - You might want to change the image name in
app-k8s-manifest/deployment.ymlfile instead of going withankitjodhani/prometheus:learning - The
app-k8s-manifest/service.ymlwill create a LoadBalancer to expose the app on the internet. Apply the file:
kubectl apply -k app-k8s-manifest/
- Head over to the AWS console and verify the load balancer (Classic Load Balancer).
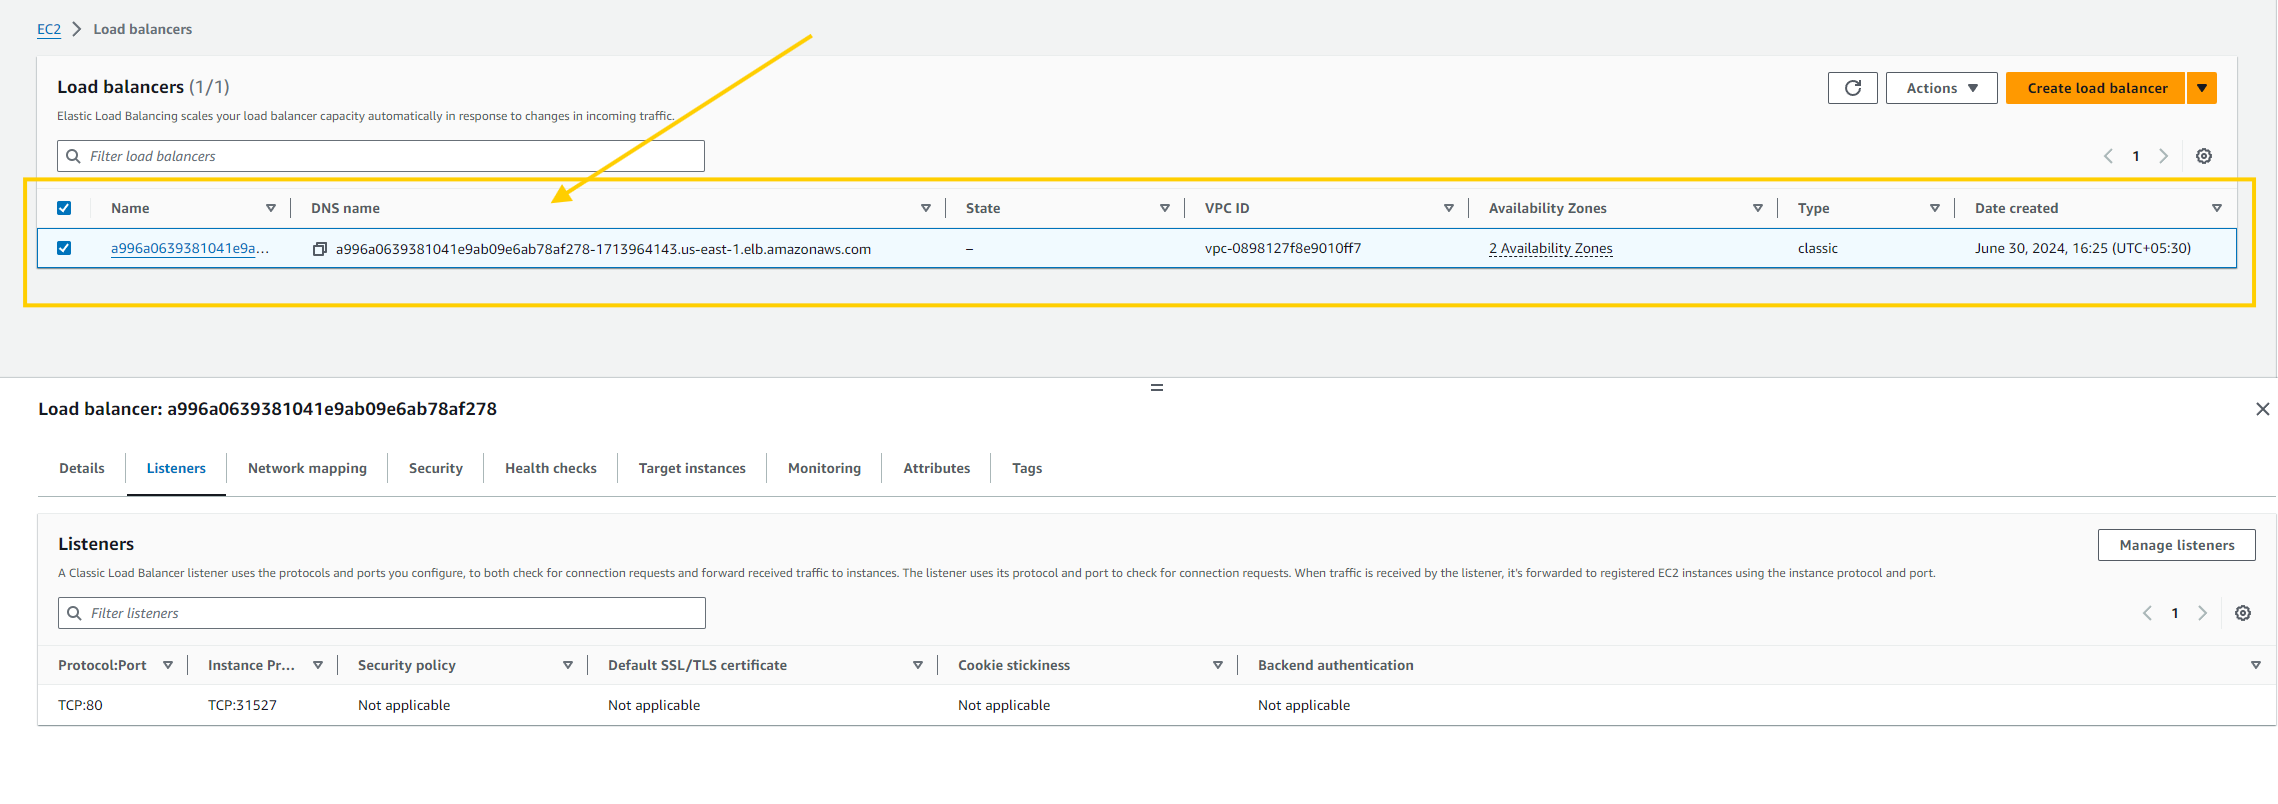
- Now, you can take the DNS name of the Load Balancer and visit the website.
- It's good to generate a load using an automated script. In the root directory, you will find
test.sh, which will generate the load by sending a lot of requests. - So, open another new terminal and execute the below command. just like shown in the below image.
./test.sh YOUR_LOAD_BALANCER_DNS_NAME
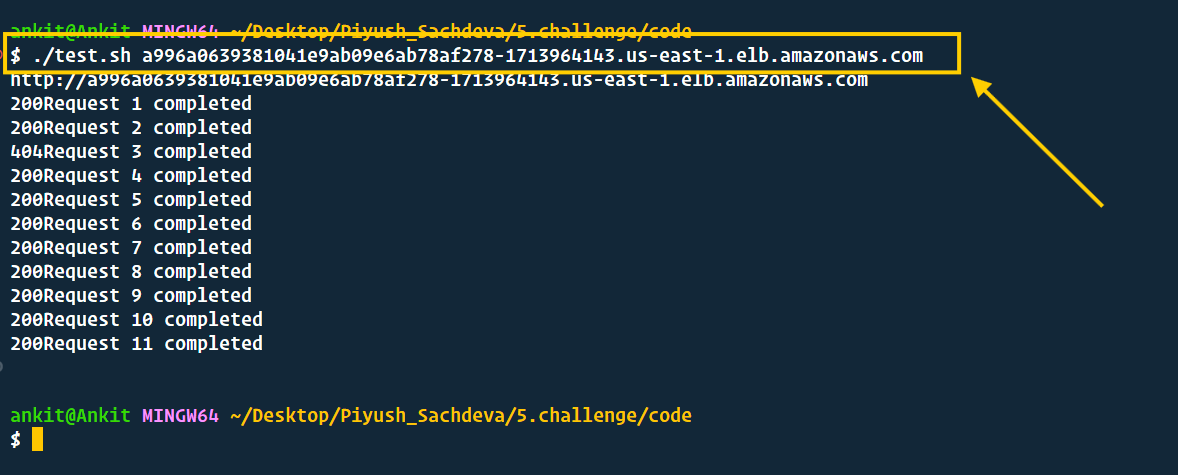
- Note: Keep running the
test.shand don't kill the terminal for a while.
⚓ Install the Helm chart
- Execute the below commands and install helm charts
helm repo add prometheus-community https://prometheus-community.github.io/helm-charts
helm repo update

helm repo add grafana https://grafana.github.io/helm-charts
helm repo update
⚒️ Install & Configure Prometheus Operator
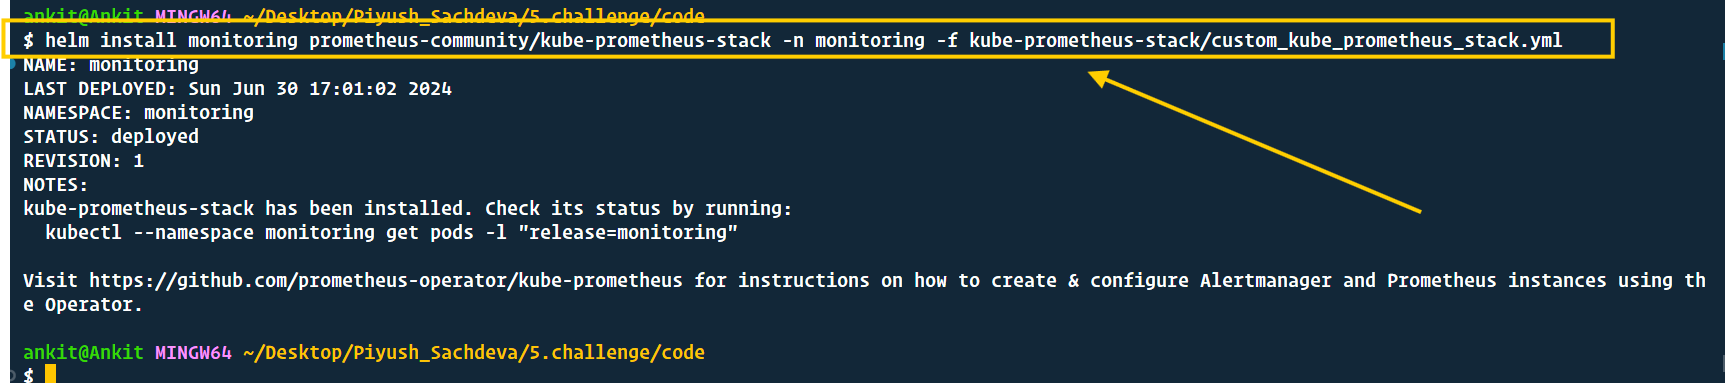
- Now, let's install the Prometheus operator in the AWS EKS Cluster using the helm chart.
- You will find all the Prometheus-related manifest files inside
kube-prometheus-stackdirectory.
kubectl create ns monitoring

helm install monitoring prometheus-community/kube-prometheus-stack -n monitoring -f kube-prometheus-stack/custom_kube_prometheus_stack.yml
- It's time to configure custom Alerts, an Alertmanager to receive emails, and a ServiceMonitor to scrape our application metrics.
- Before configuring Alertmanager, we need credentials to send emails. For this blog, I'm using Gmail, but any SMTP provider like AWS SES can be used. so let's grab the credentials for that.
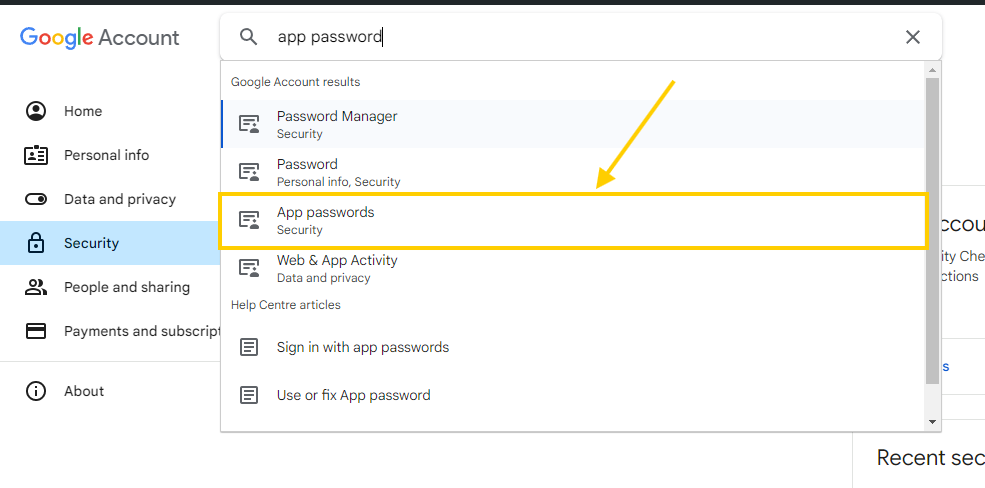
- Open your Google account settings and search
App password& create a new password.
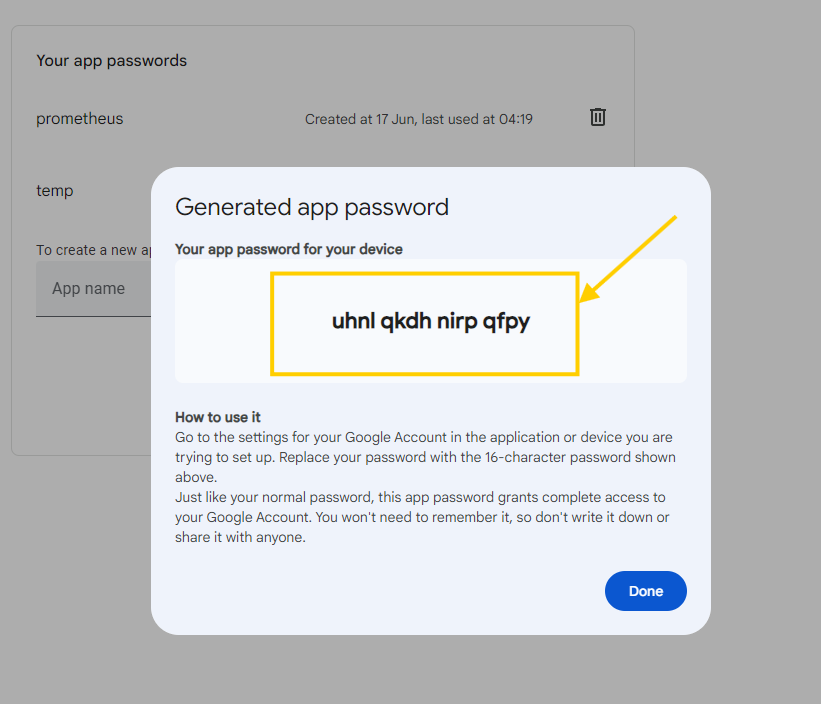
- Copy the newly created password. it should be like
uhnlqkdhnirpqfpy
- Convert that password into base64 format.
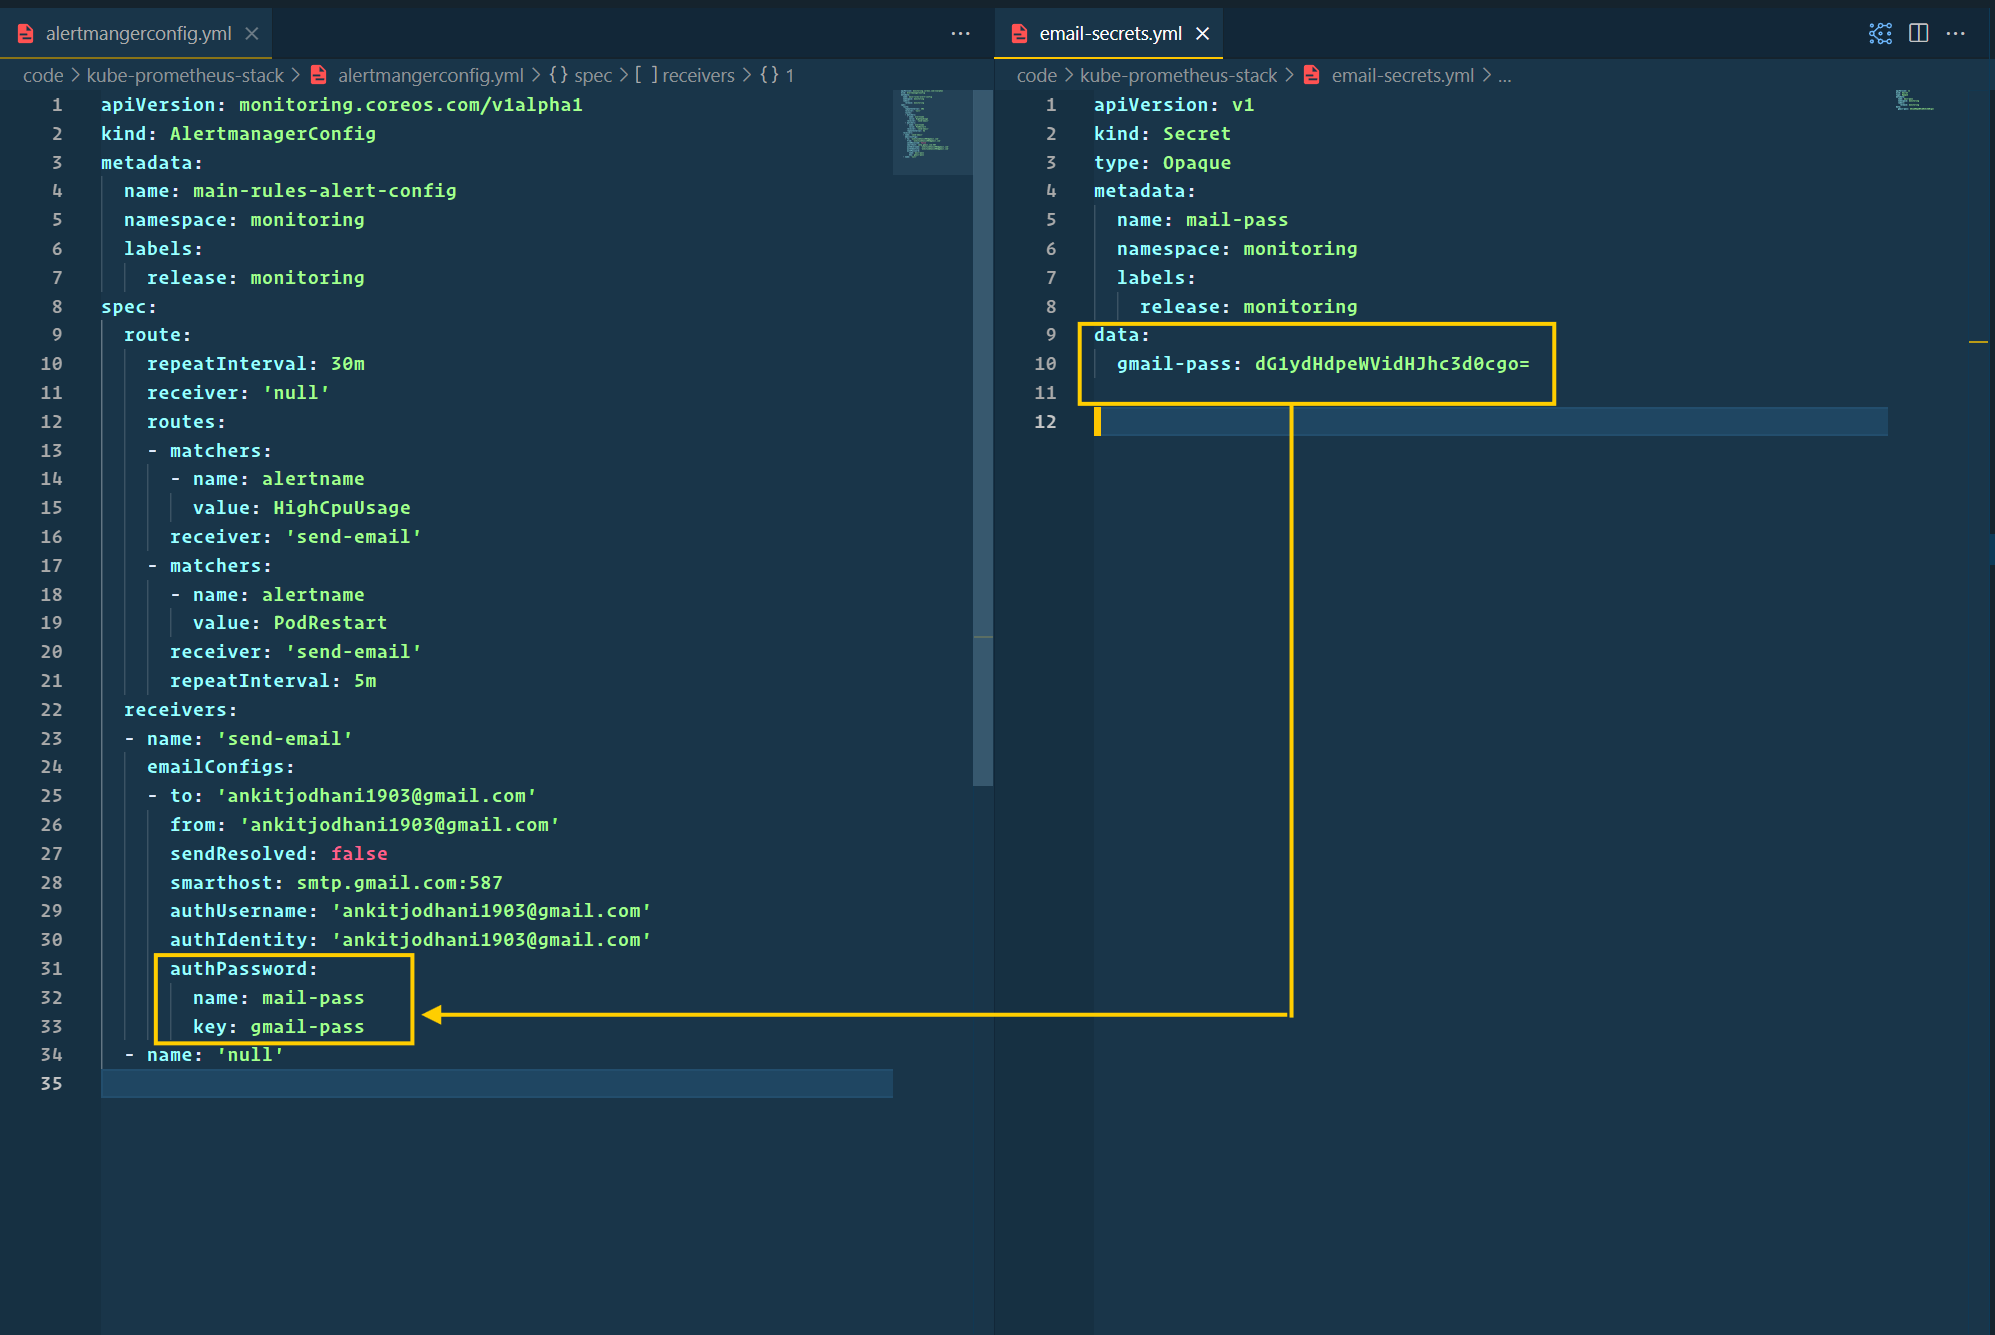
- Now, put your password in the
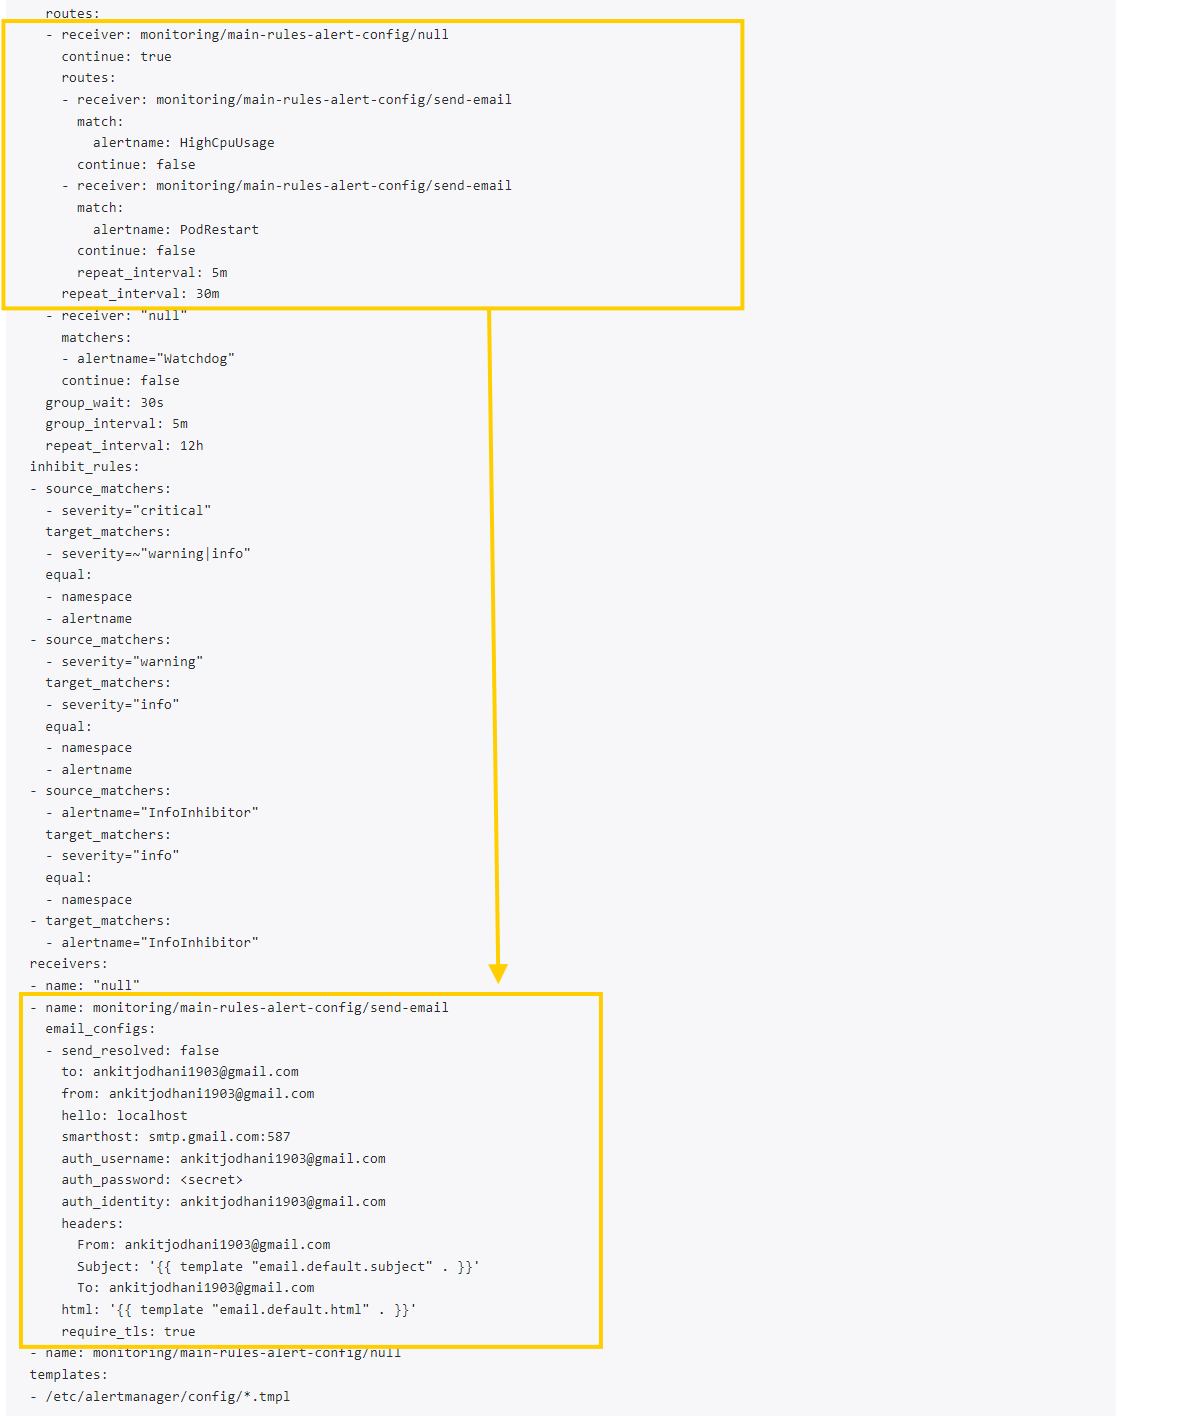
kube-prometheus-stack/email-secret.ymland add your email ID to thekube-prometheus-stack/alertmanagerconfig.ymlinstead of mine.
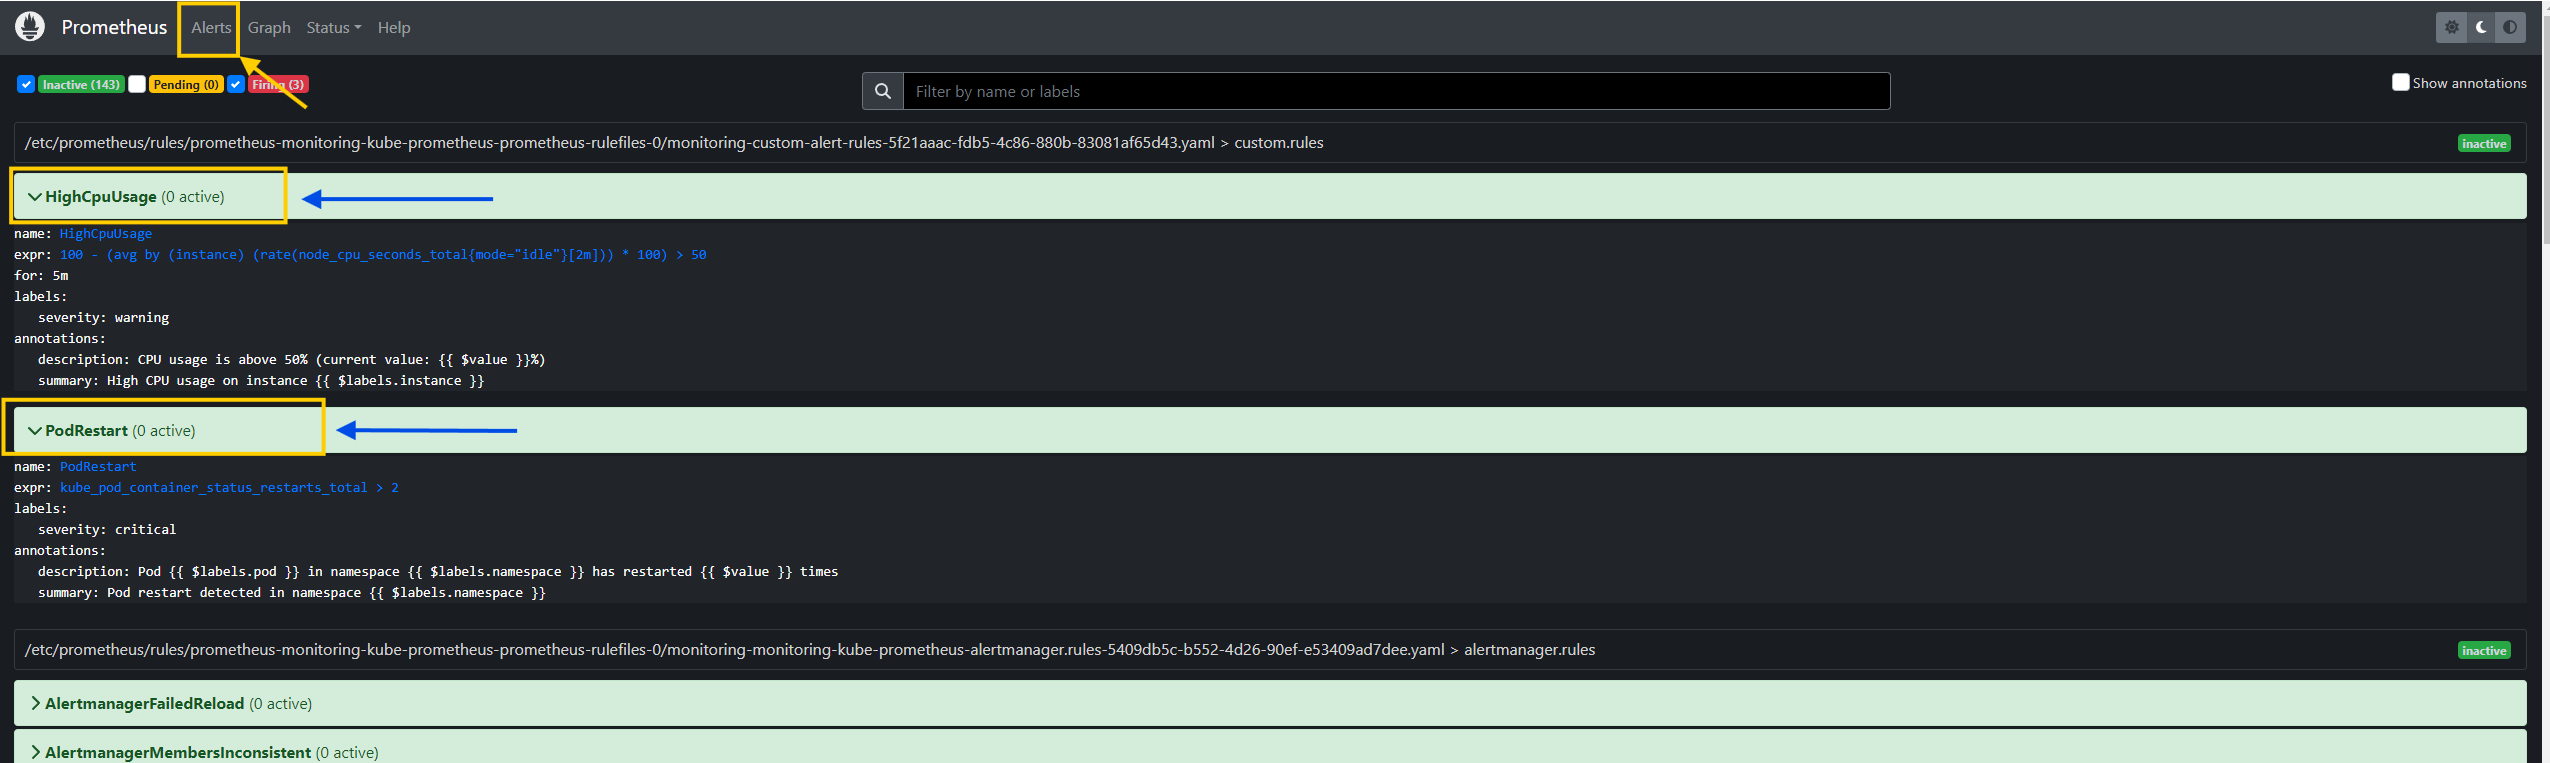
- You can also take a look at
kube-prometheus-stack/alerts.ymlfile to see the Rules that I've set for the alerts.- Send an alert when the average node CPU is higher than 50%.
- Send an alert when a POD restarts more than 2 times.
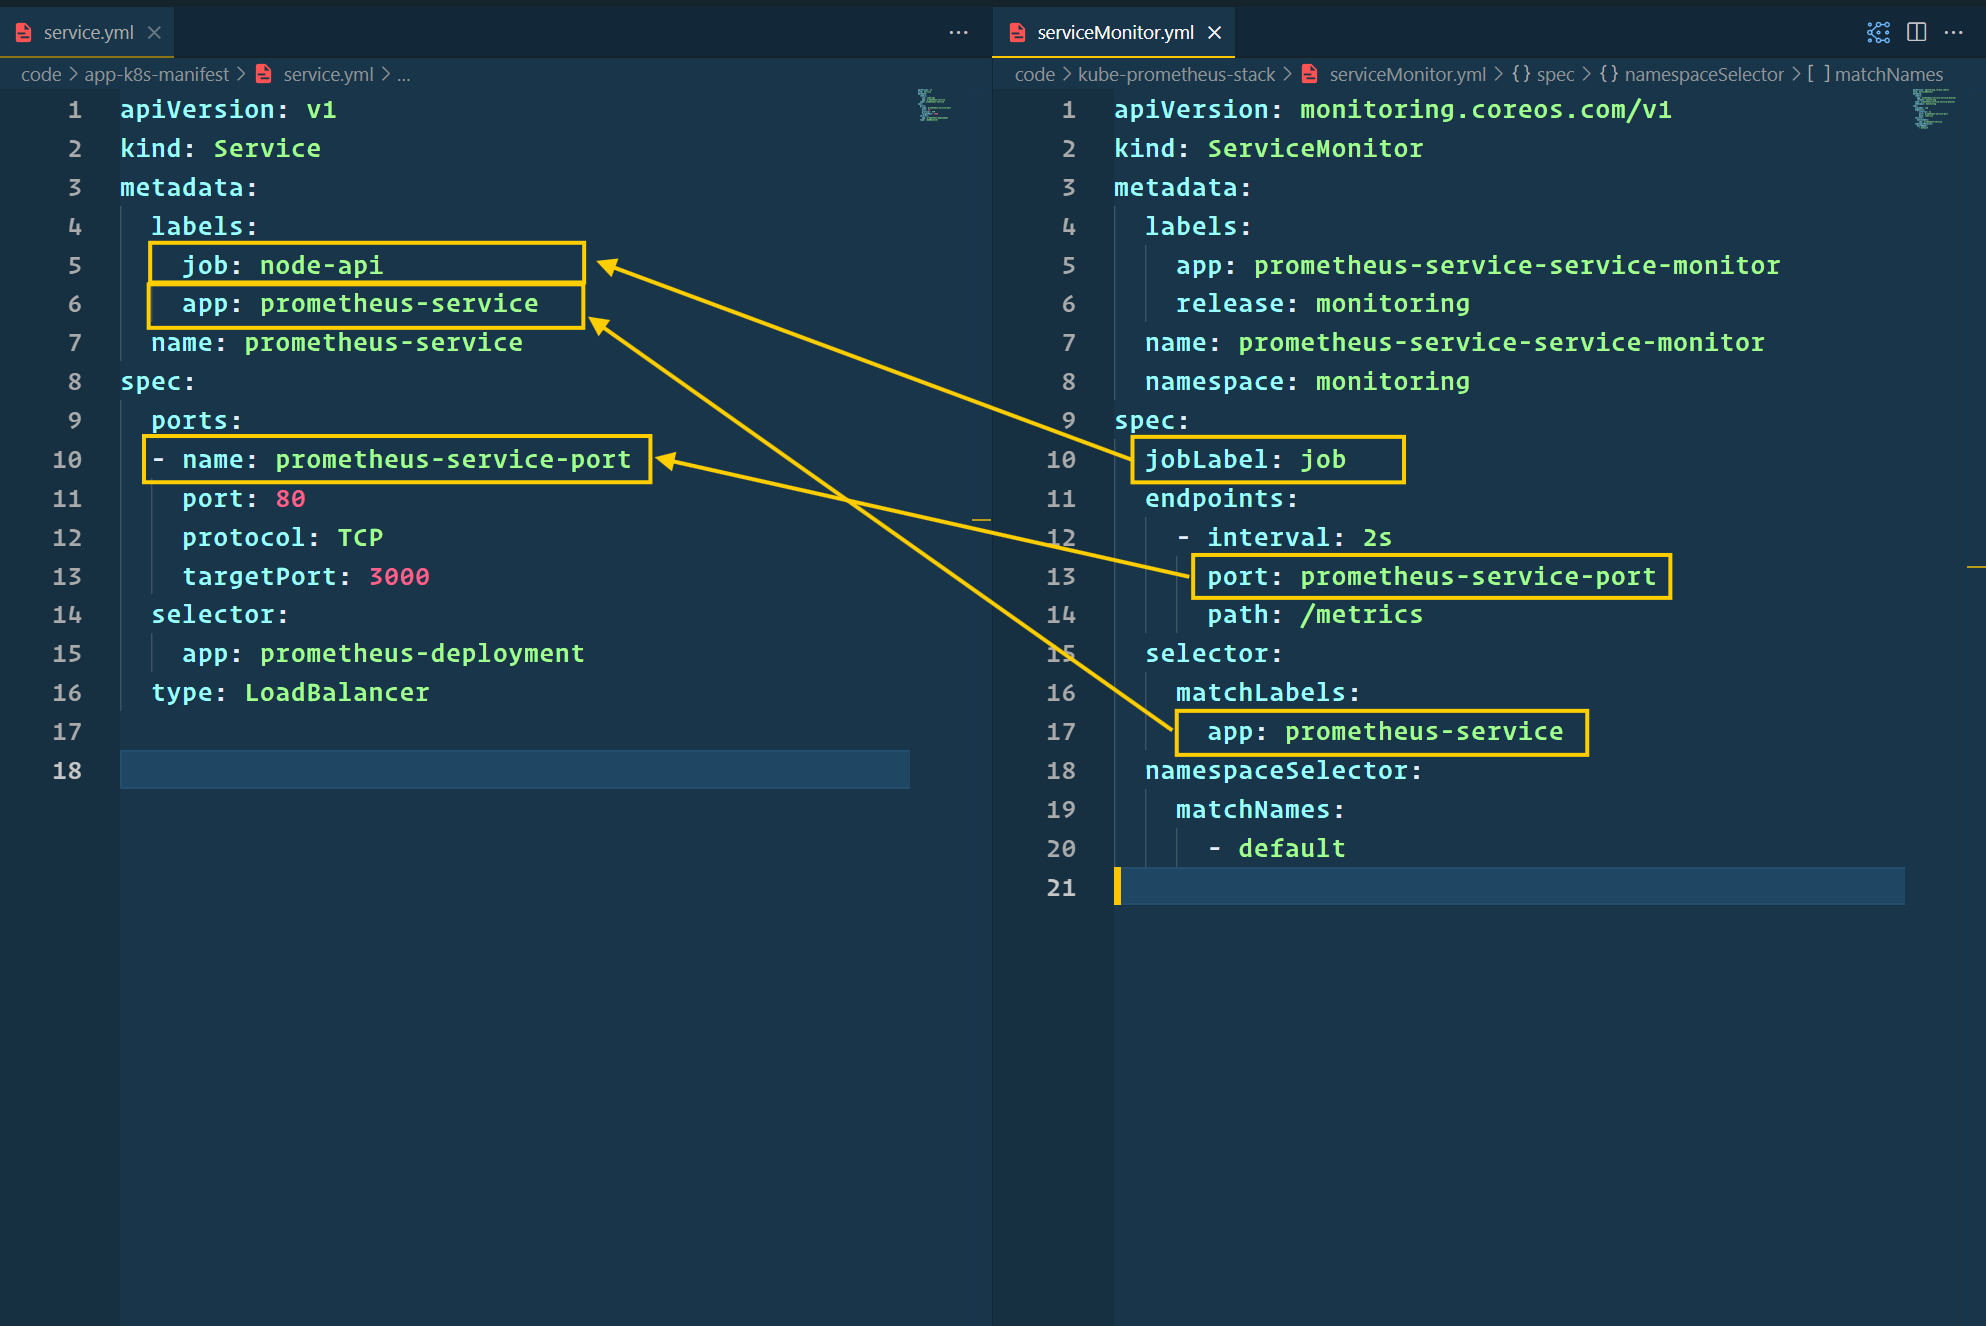
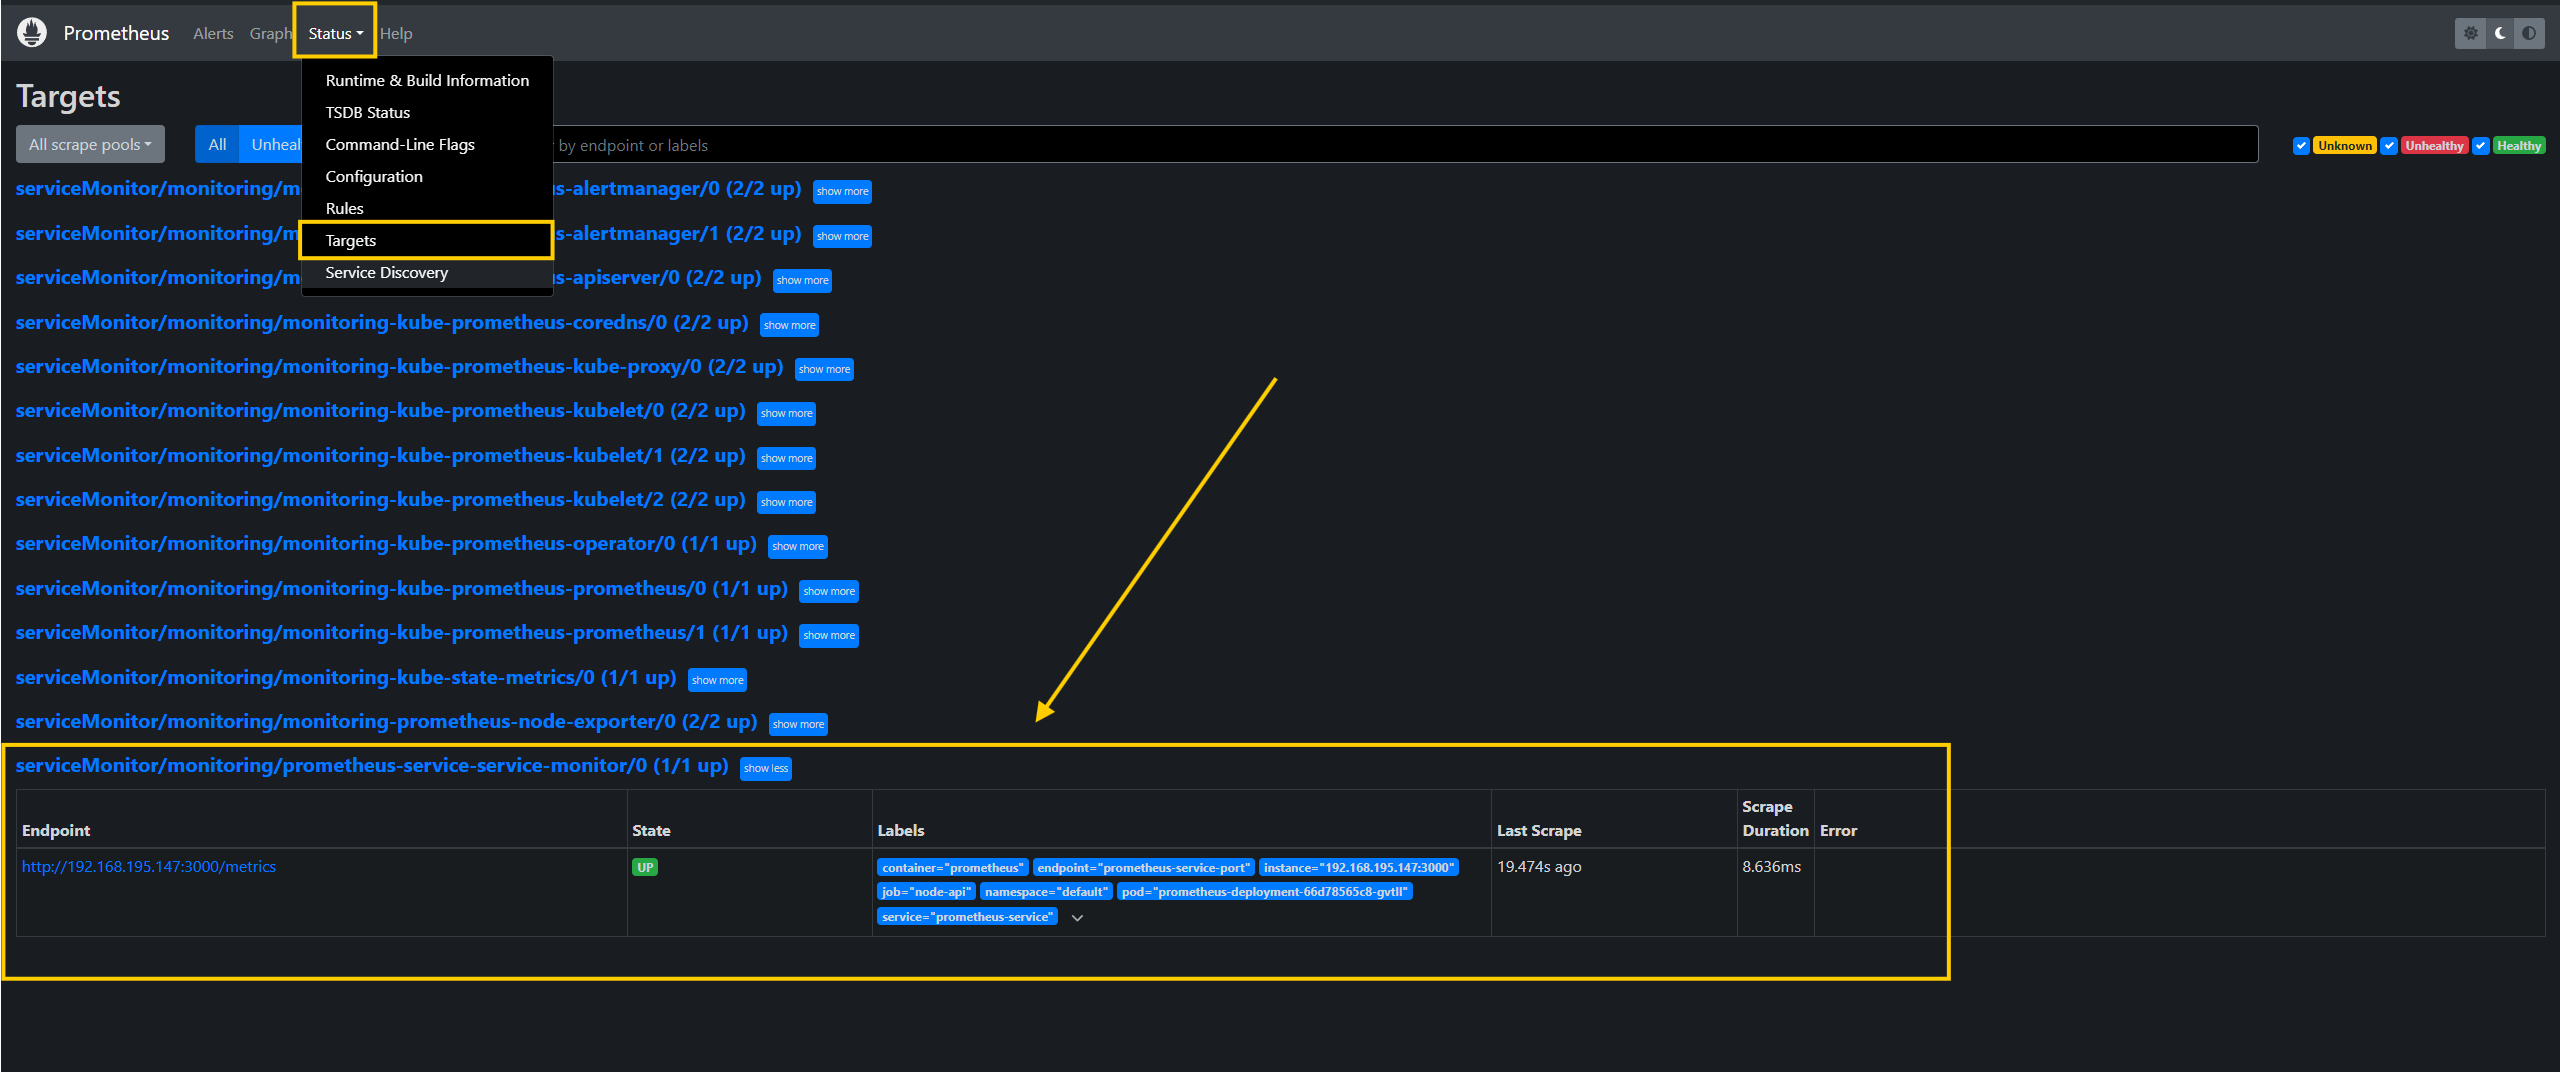
- Next, we will configure the Service Monitor to scrape the metrics from our Node.js application.
- Refer to
kube-prometheus-stack/serviceMonitor.ymlfor the configuration.
- It's time to apply all these configurations. Execute below command
kubectl apply -k kube-prometheus-stack/
- We need to wait for a couple of minutes for the Prometheus operator to reload its configuration.
- Now, let's visit the Prometheus UI by running the following command and visiting
http://localhost:9090.
kubectl port-forward -n monitoring service/prometheus-operated 9090:9090
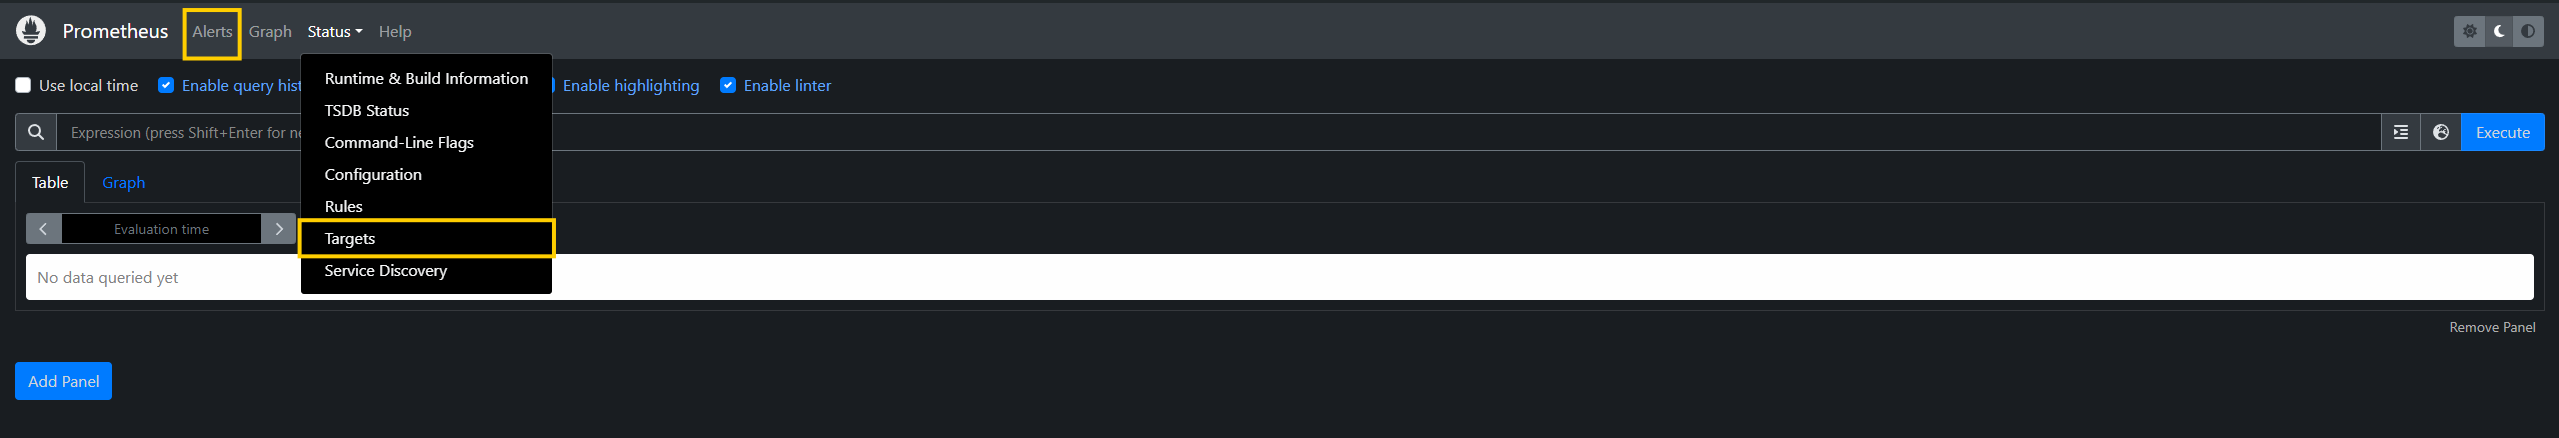
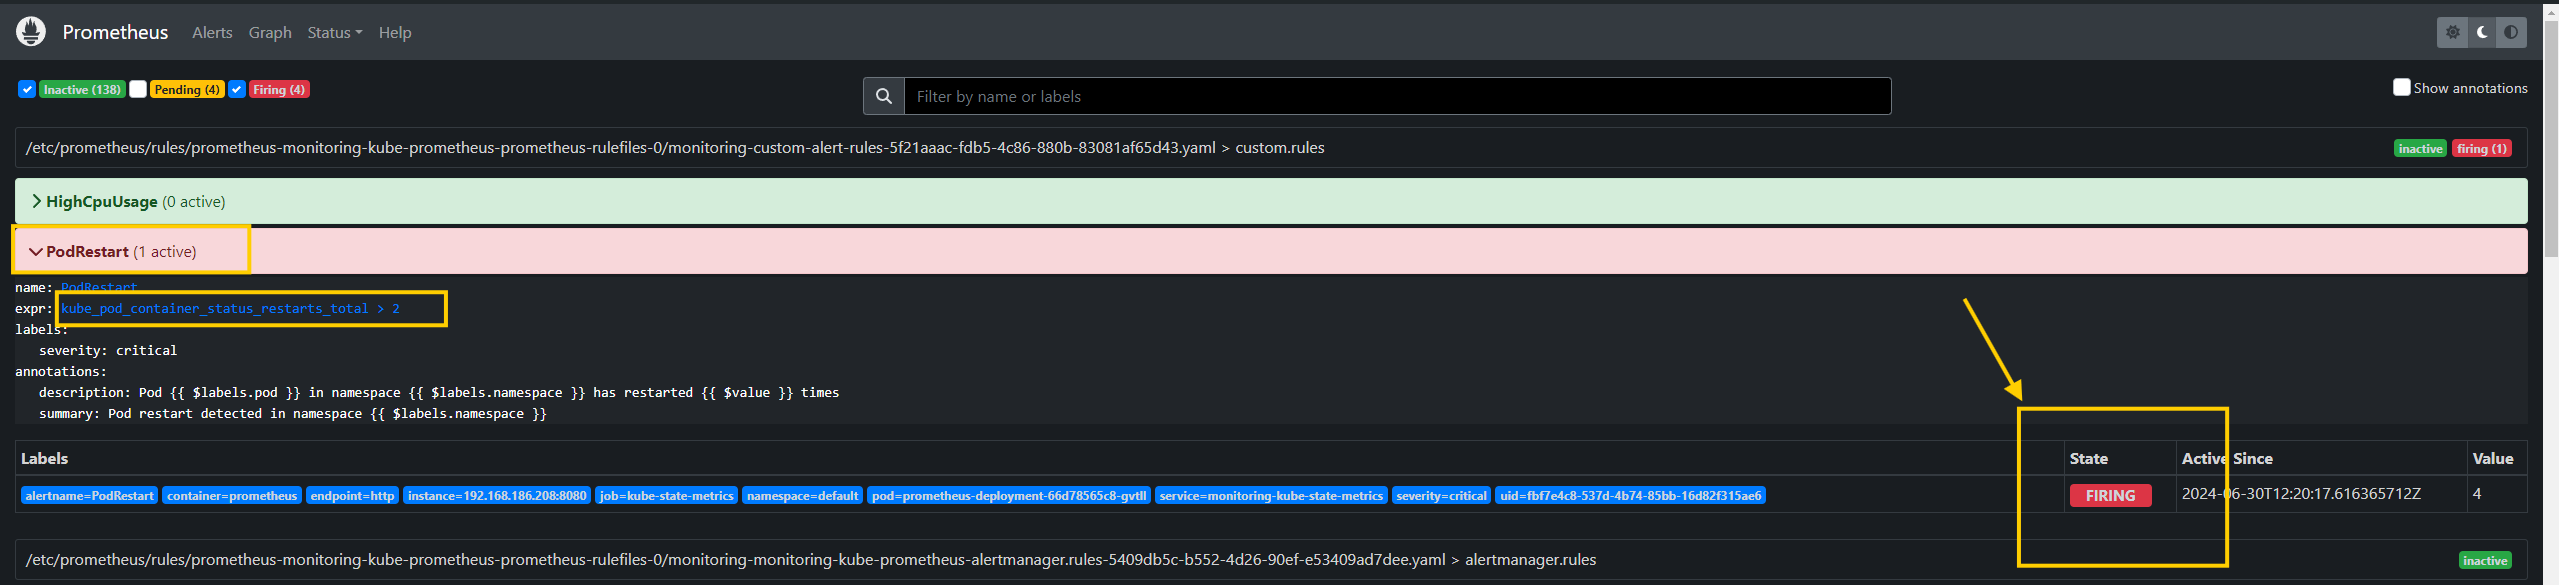
- To check the applied rules, click on the
Alertsbutton at the top.
- Verify the target configuration by clicking the
Targetsbutton from the drop-down menu.
- Let's access the Alertmanager UI to see the alert configurations. Run the following command and visit
http://localhost:9093.
kubectl port-forward -n monitoring service/alertmanager-operated 9093:9093
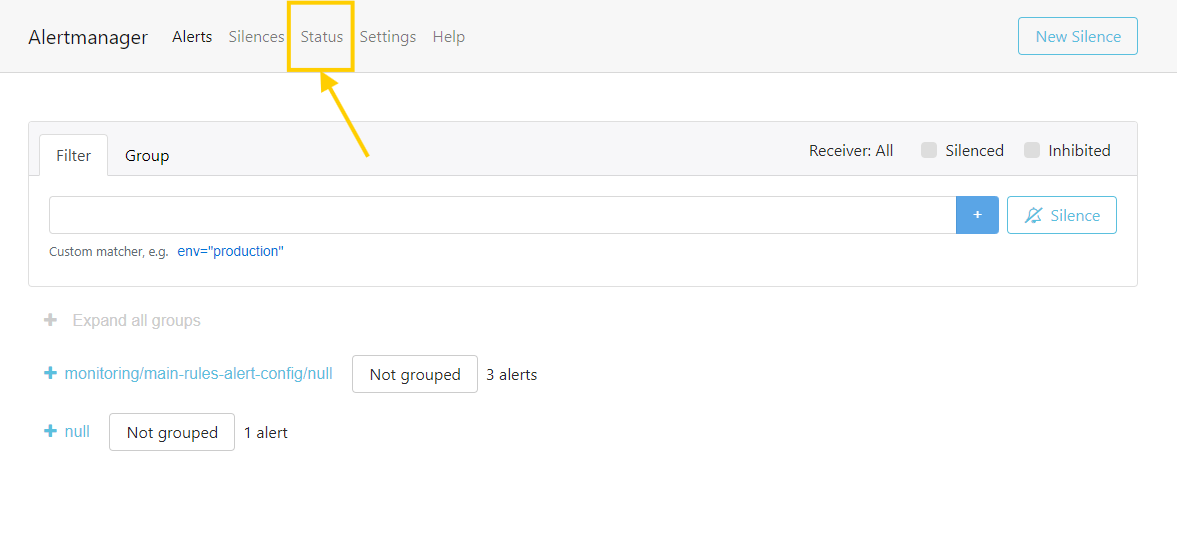
- Click on the
Statusbutton at the top to see the applied configurations.
- Now, let's crash the Node.js app twice to receive alerts from Alertmanager.
- The Nodejs app has a route
/crash, which crashes the container, and Kubernetes automatically restarts it. However, if the app crashes more than 2 times, Alertmanager will send an alert to our email. - let's see that practically
http://YOUR_LOAD_BALANCER_DNS_NAME/crash
- Keep hitting the above endpoint until Kubernetes restarts at least 3 times.
kubectl get pods

- Check the alert in the firing state by running:
kubectl port-forward -n monitoring service/prometheus-operated 9090:9090
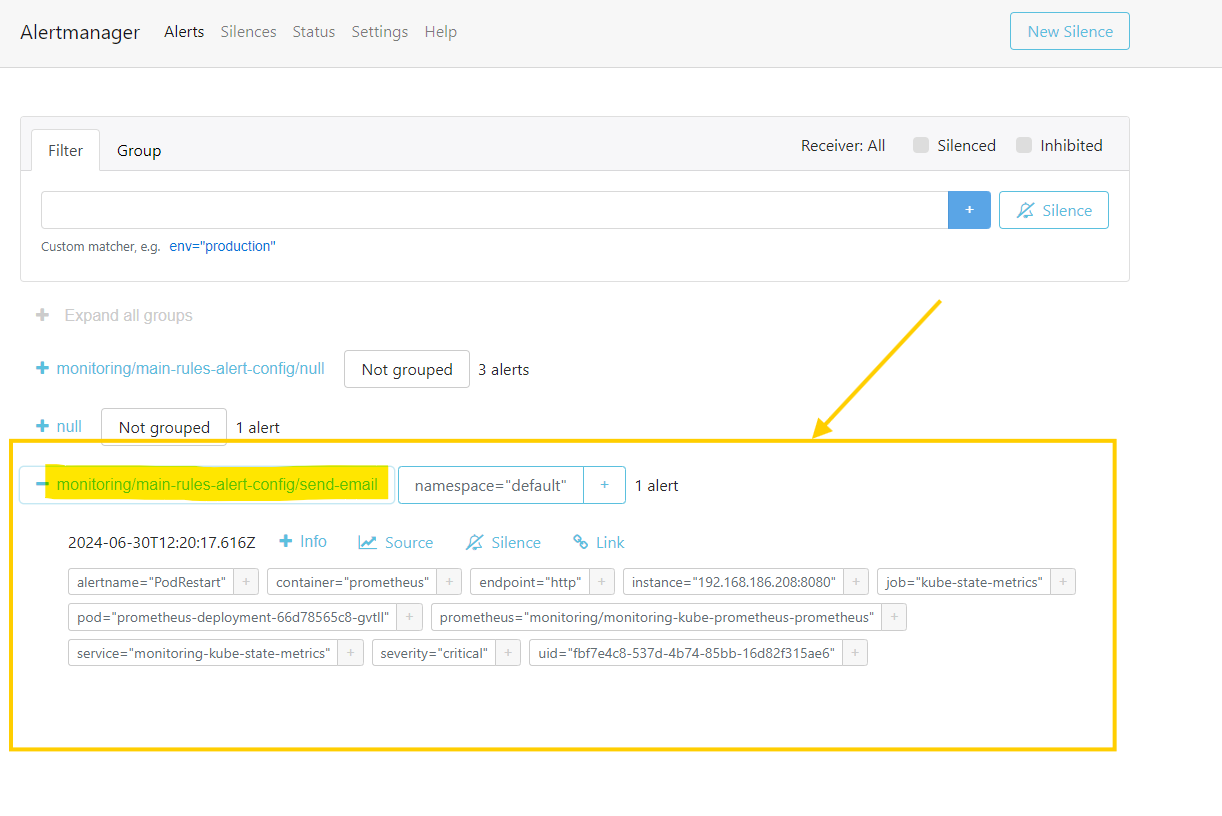
- Verify Alertmanager received an alert from Prometheus:
kubectl port-forward -n monitoring service/alertmanager-operated 9093:9093
- You should receive an email notification on your configured mail address.
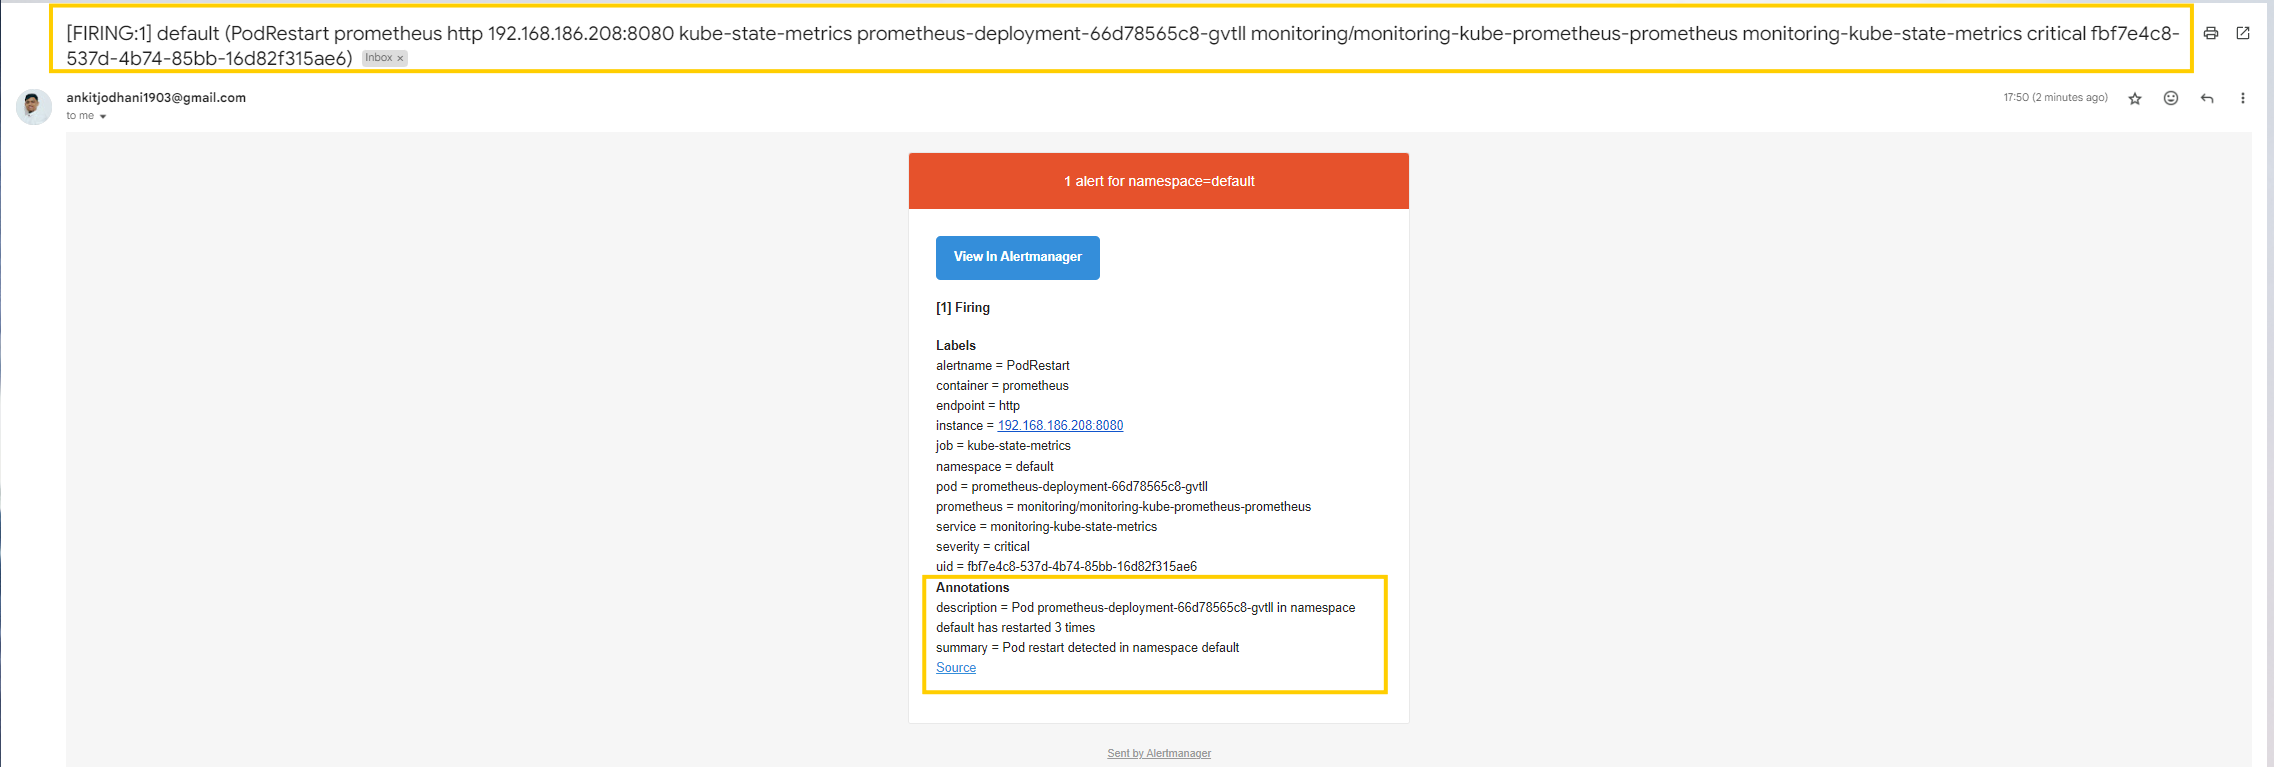
- We configured it to send emails every 5 minutes until the issue is resolved.

- Now, it's time to visualize our metrics on a beautiful dashboard. Thankfully, the
kube-prometheus-stackHelm chart automatically installs Grafana, so we don't need to install it separately. Access the Grafana UI athttp://localhost:8000:
kubectl port-forward -n monitoring service/monitoring-grafana 8000:80
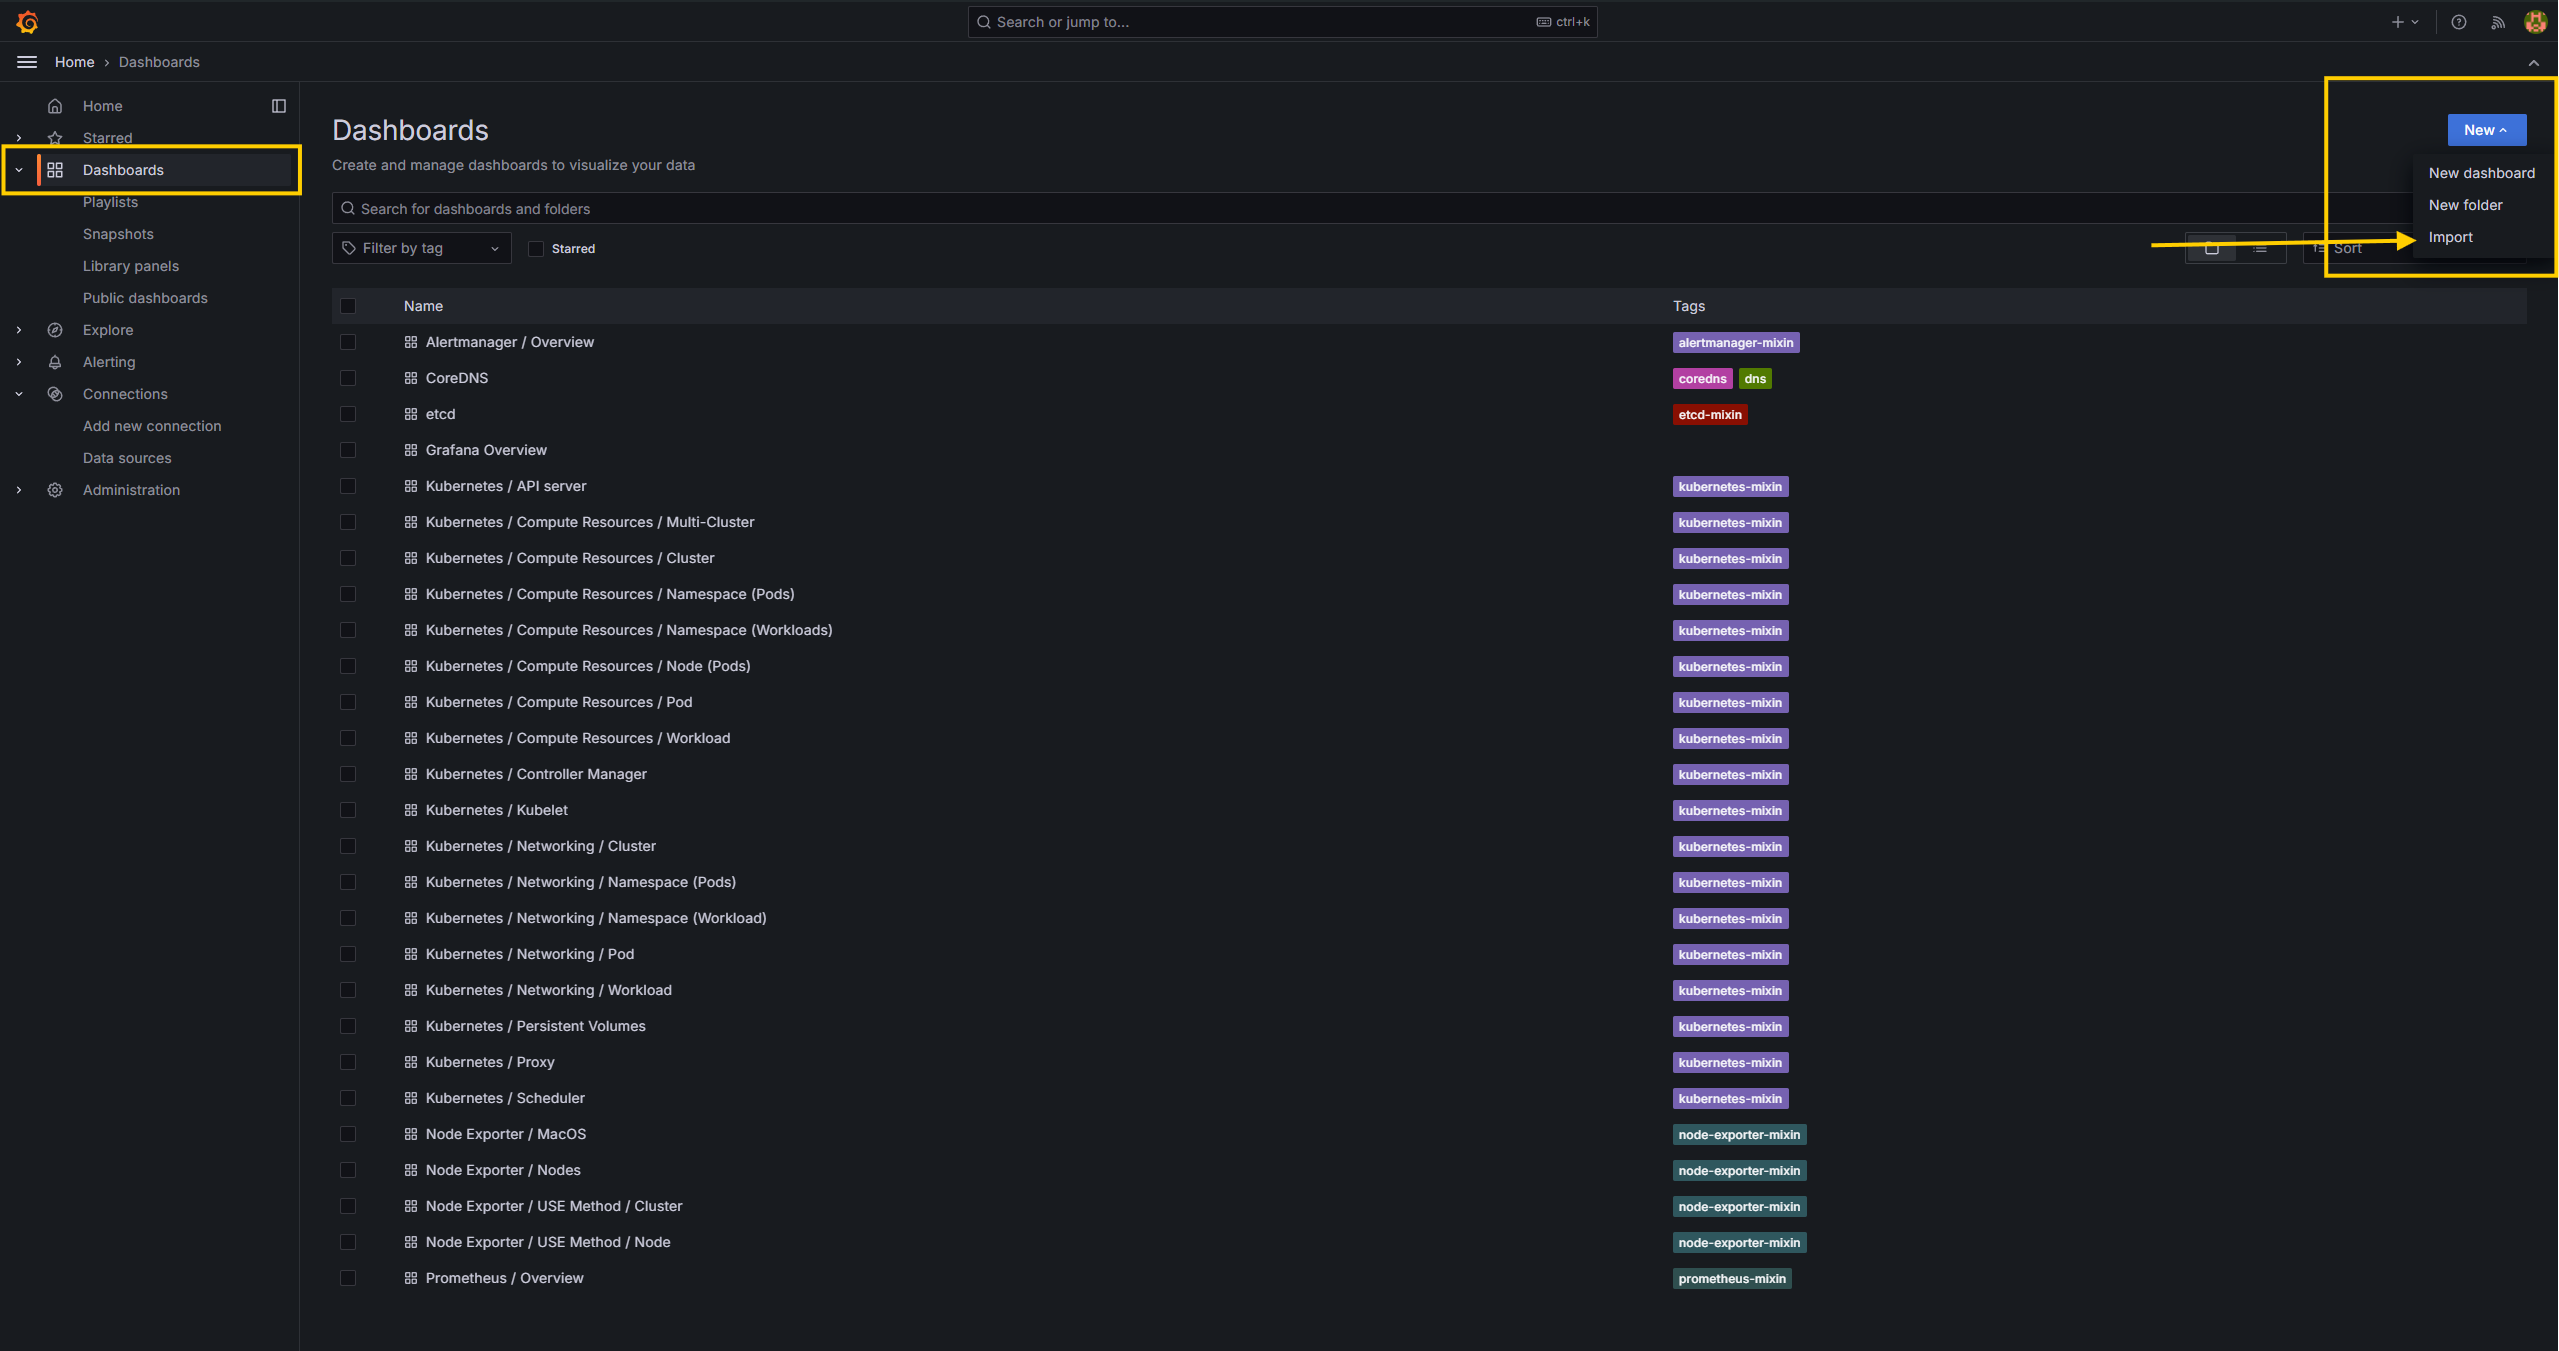
- You will see many pre-built dashboards. You can utilize them for monitoring or design/import your own.
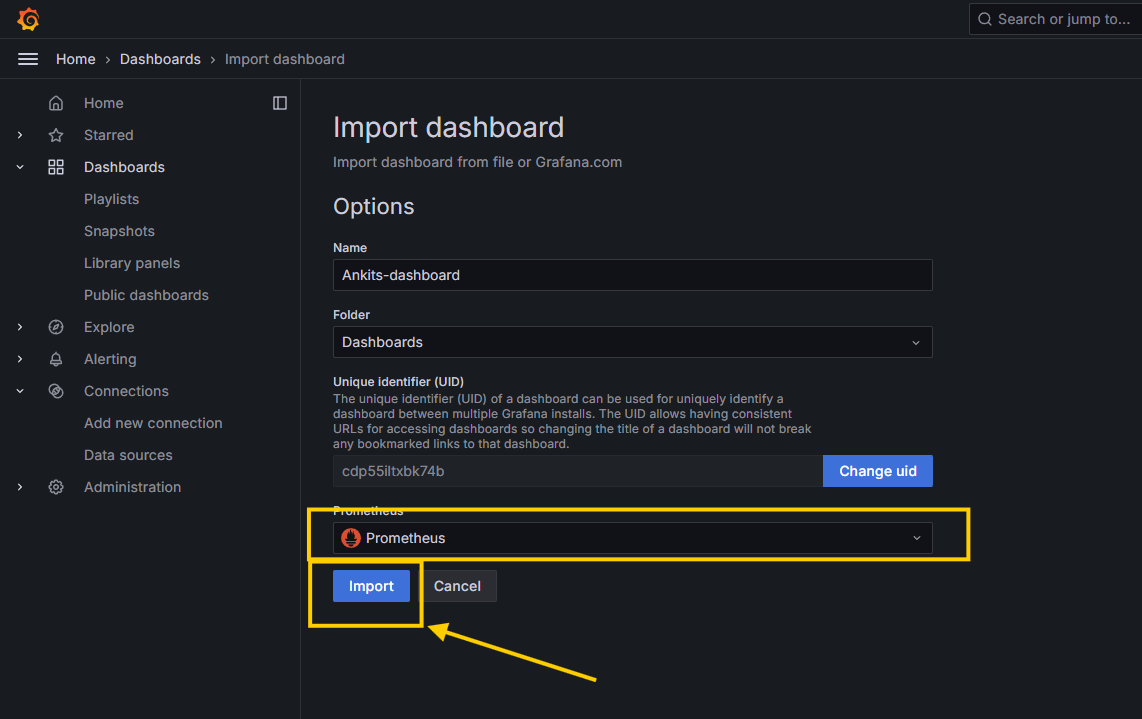
- Import the dashboard I created for the Node.js app, available in the
grafana-dashboarddirectory. - Click on the
Newbutton at the top right, selectImportfrom the drop-down menu, and import the dashboard.
- Once imported, you will see a screen similar to mine, as shown below, if you haven't stopped the
test.sh(load generator script).
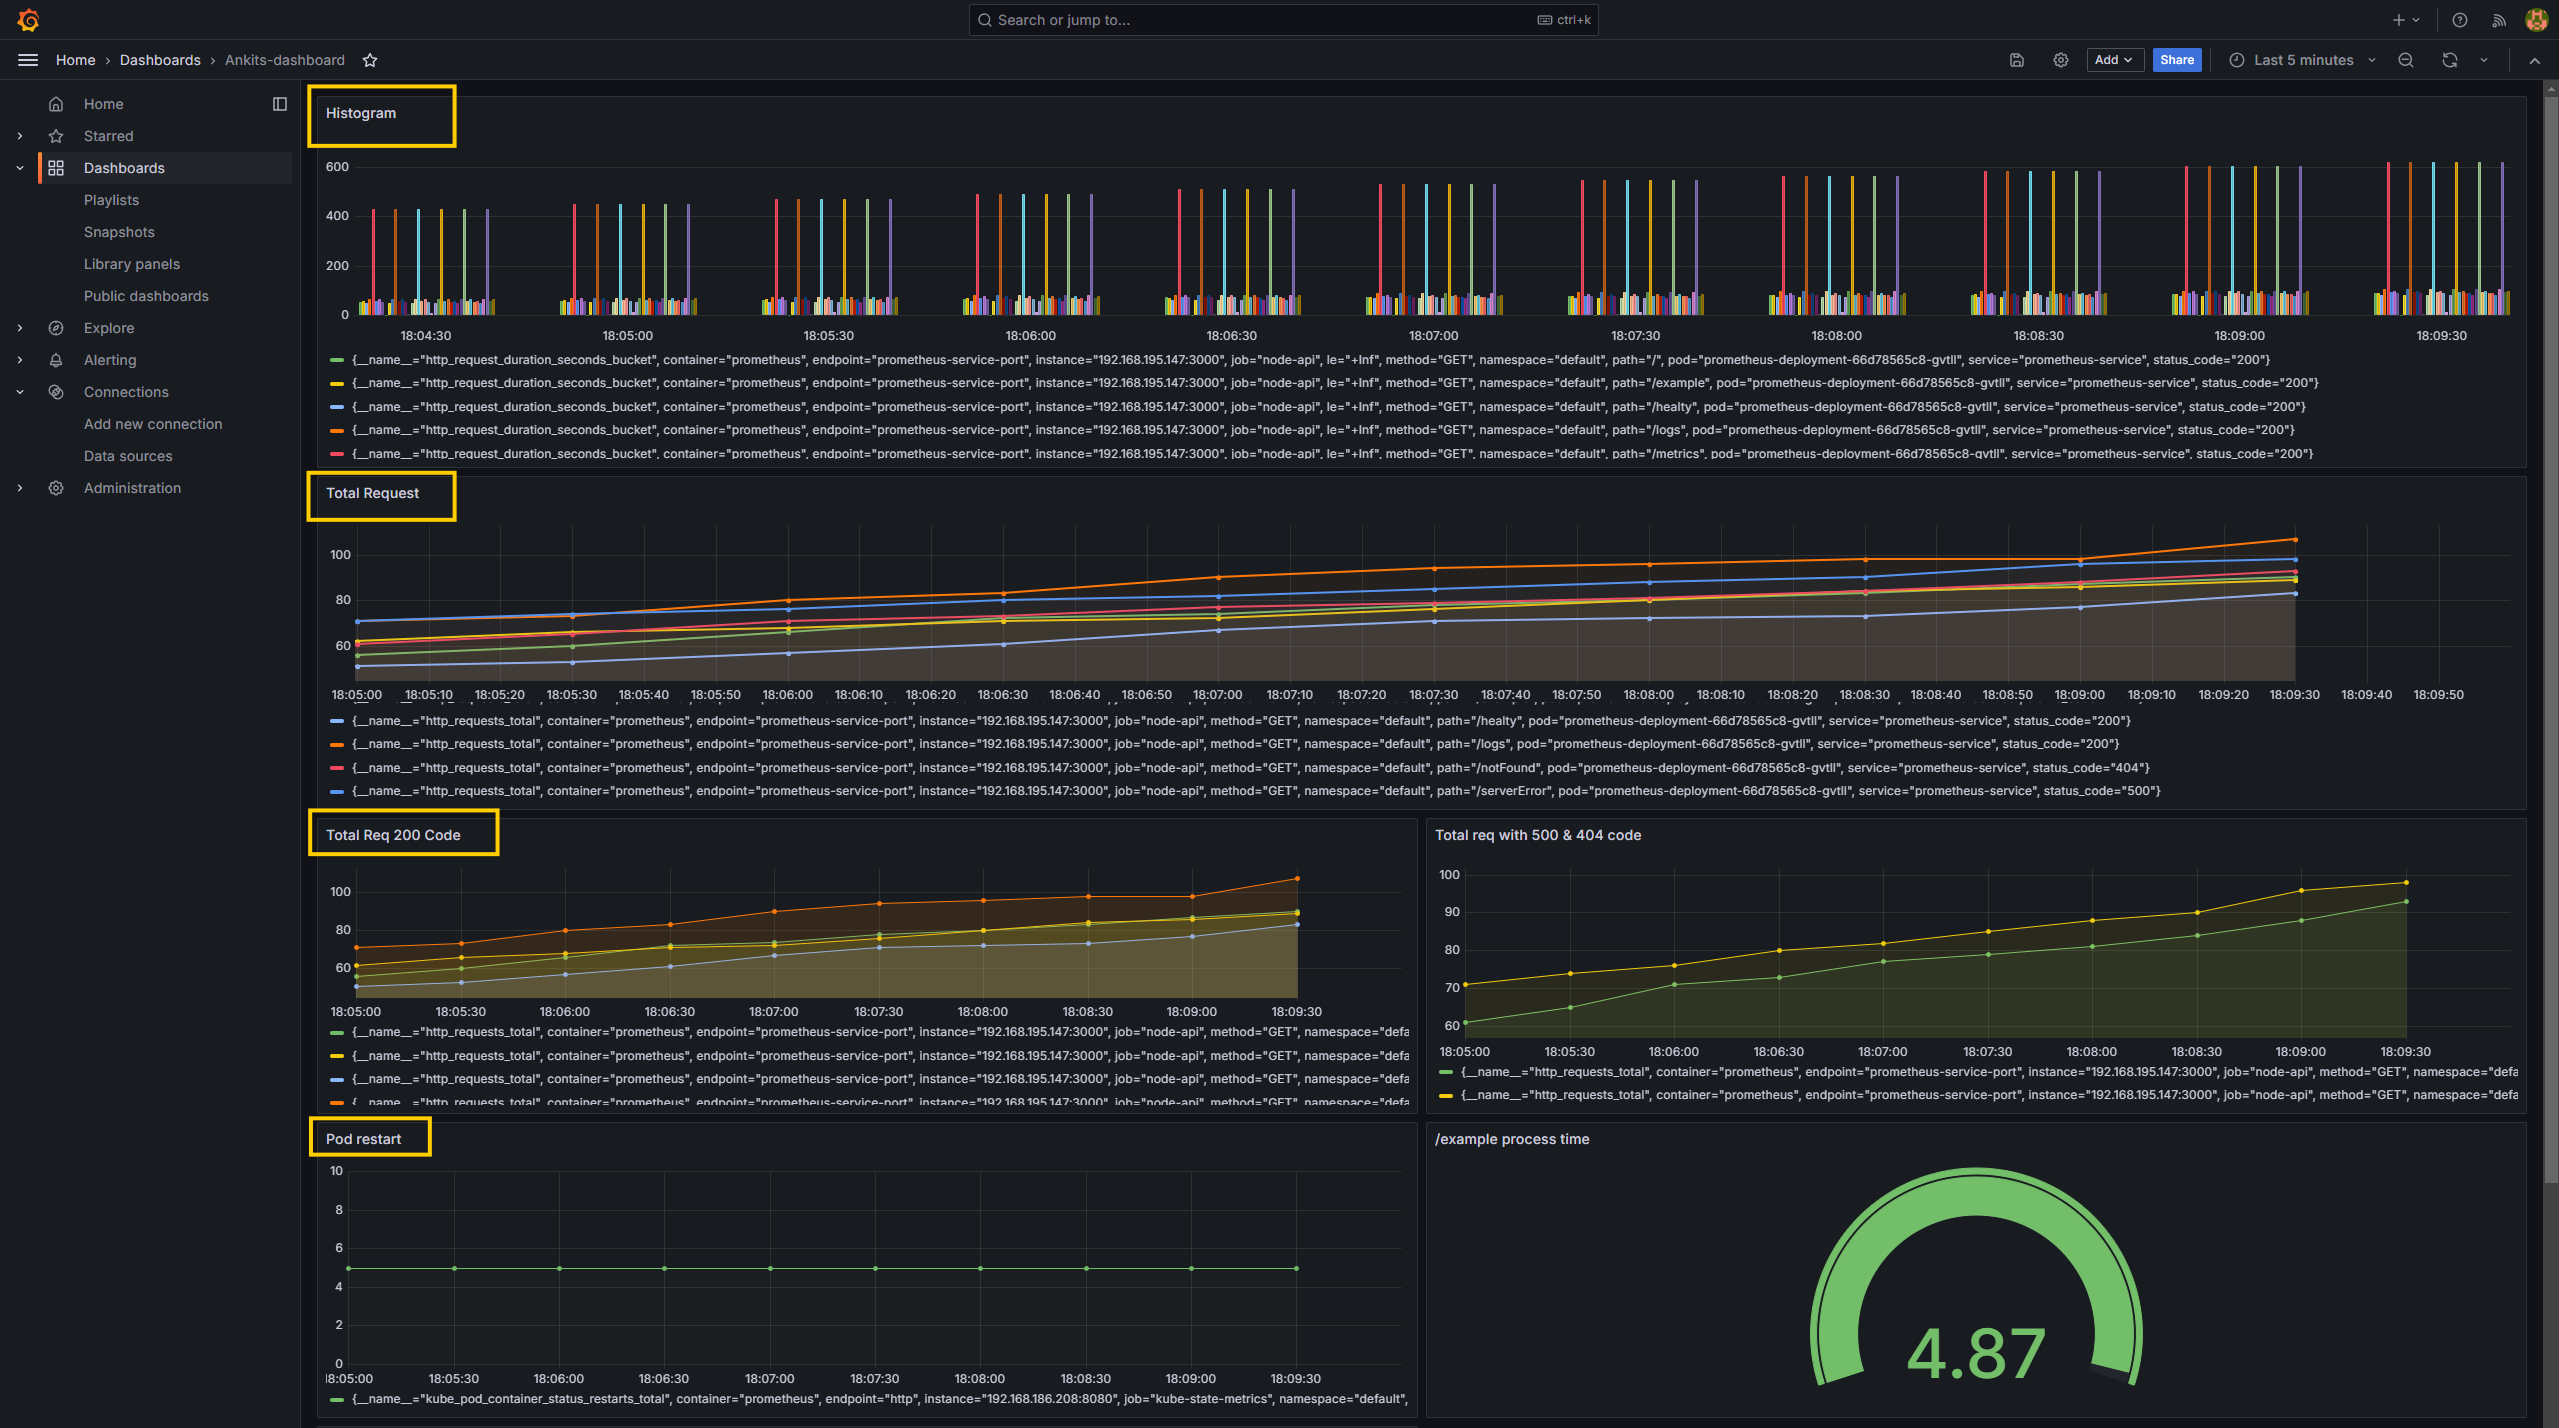
- This is how we can monitor our application, other components, and clusters from Grafana.
⚒️ Install & configure Loki
- We've set up monitoring, now let's configure Loki and Promtail for logging.
- We already added the Grafana Helm repo in the previous step, which includes both Loki and Promtail.
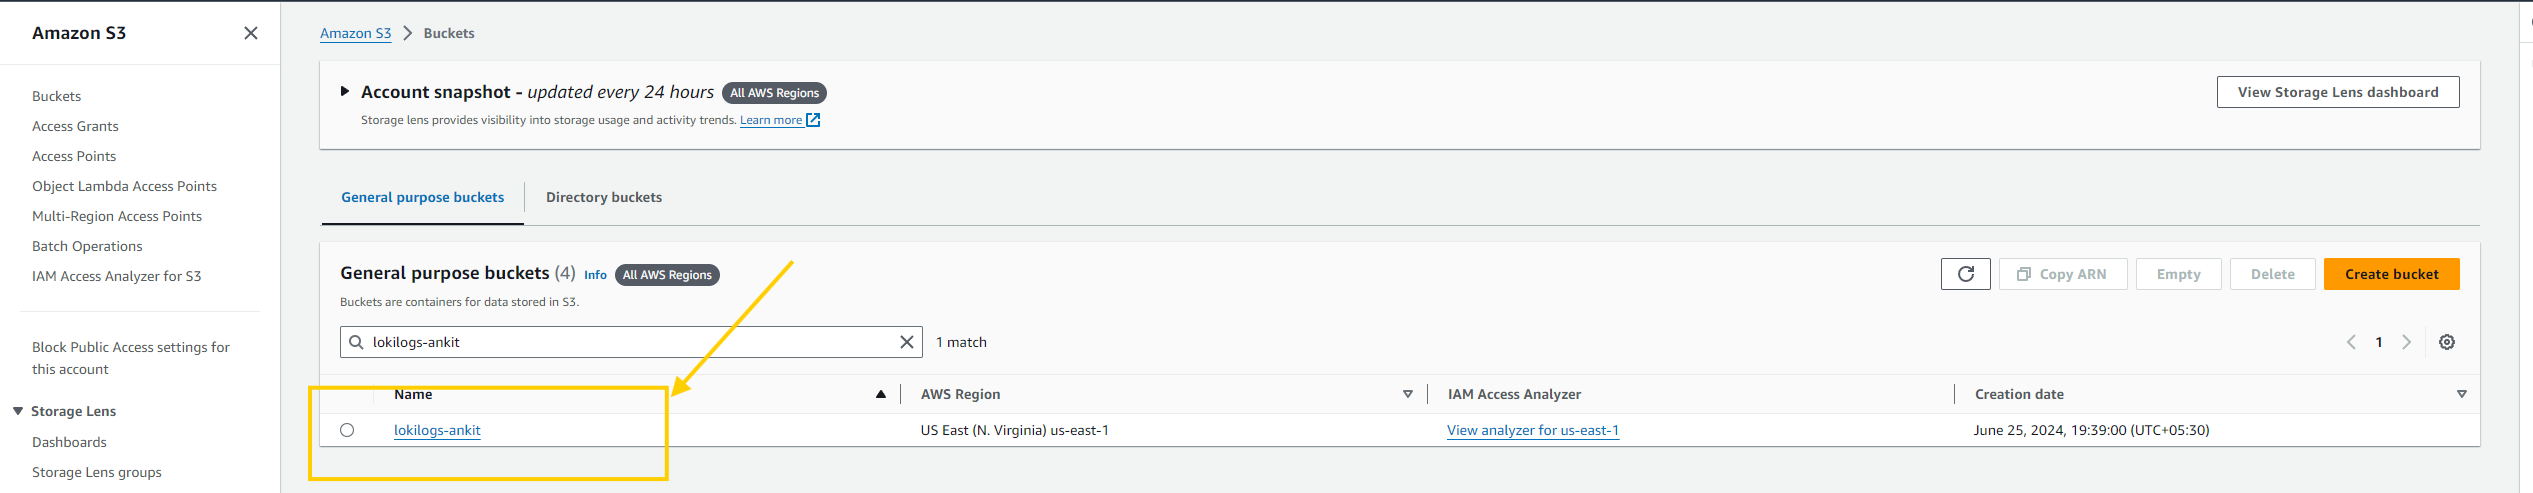
- We want Loki to store logs in an AWS S3 bucket, so it needs a bucket and relevant permissions to send logs to the AWS S3 bucket.
- Head over to the AWS S3 console and create a bucket with a unique name.
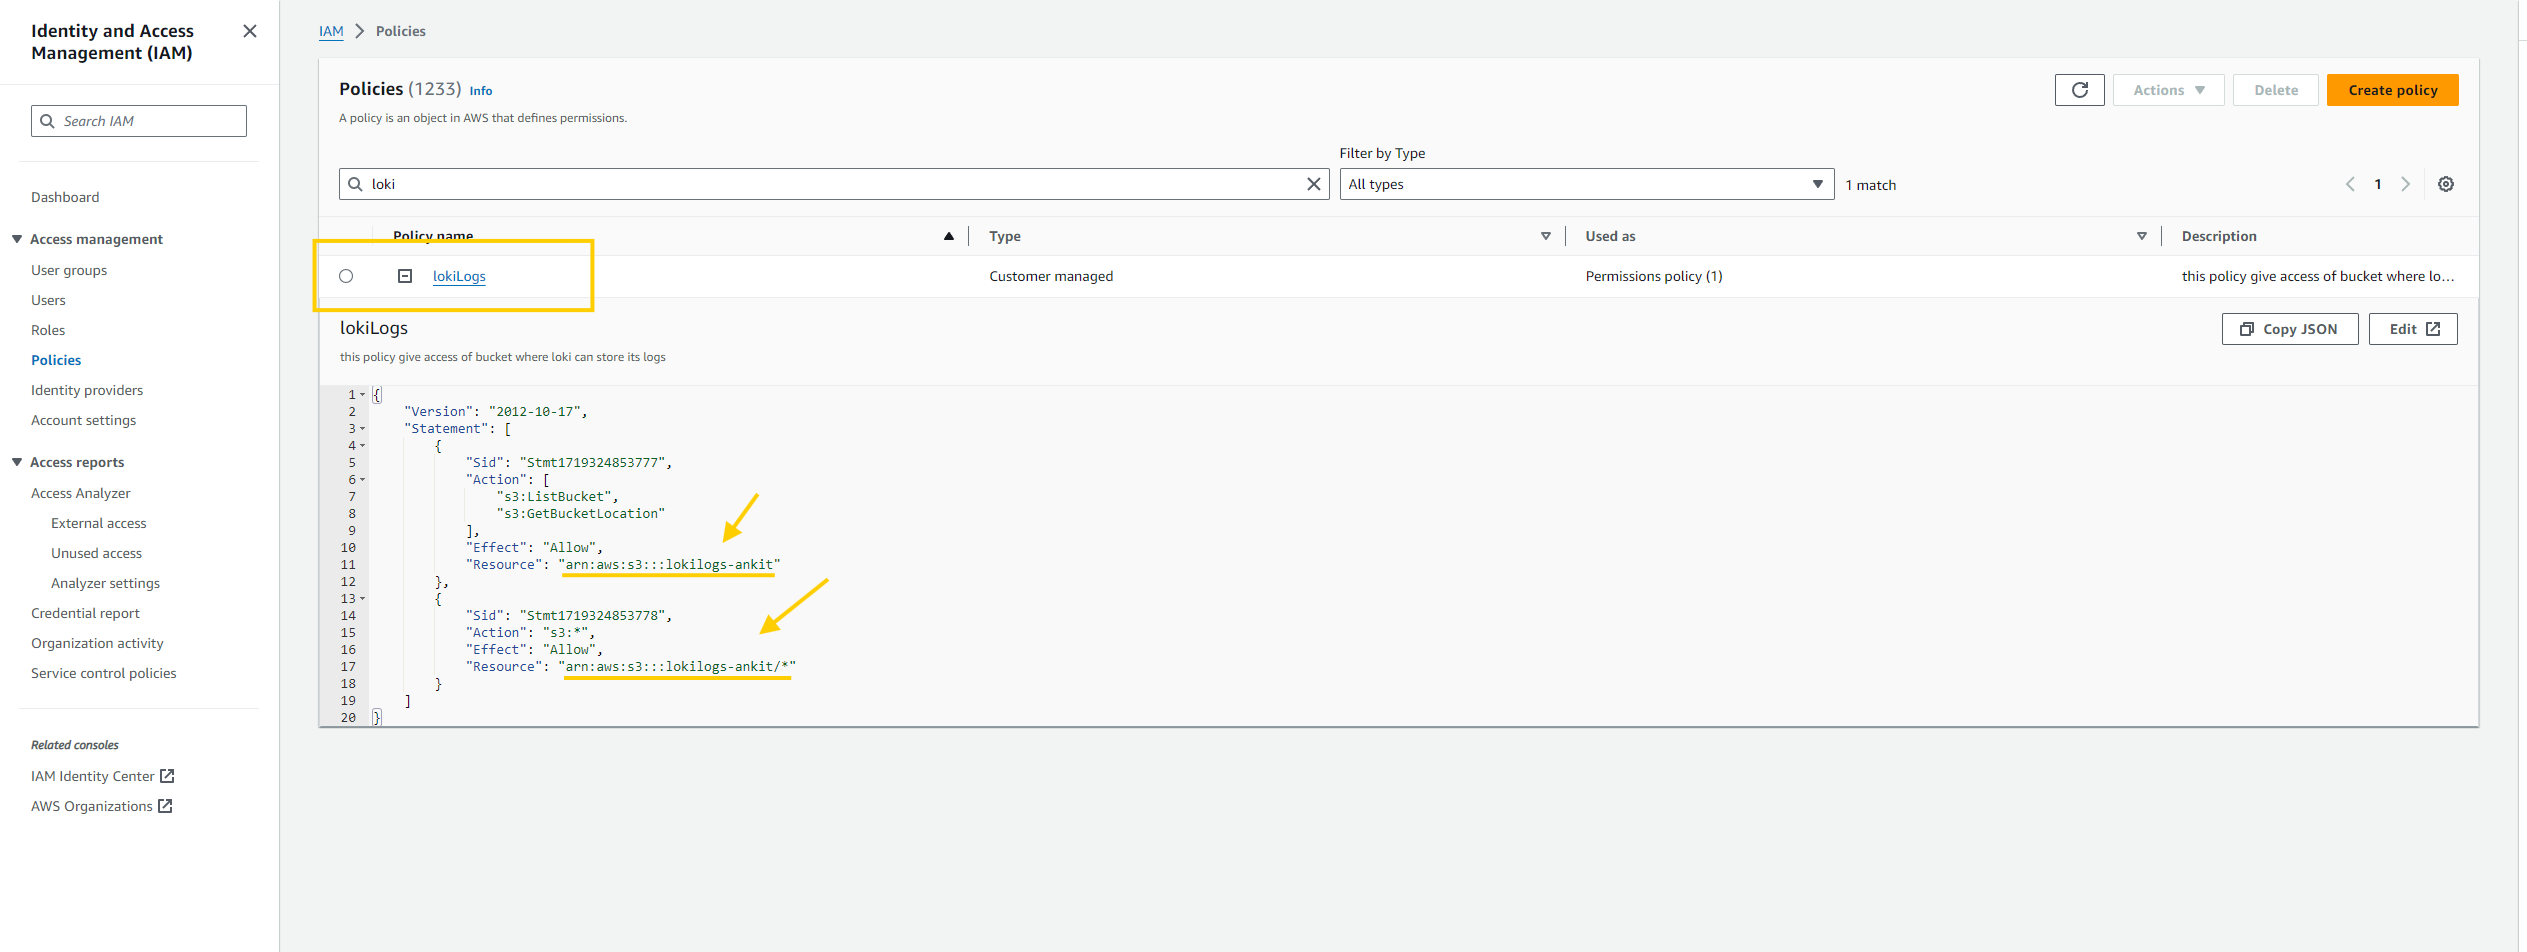
- Next, create an IAM policy in the AWS console. You can find the policy in
loki-promtail-stack/aws-s3-policy.json, but remember to add your bucket's ARN.
{
    "Version": "2012-10-17",
    "Statement": [
        {
            "Sid": "Stmt1719324853777",
            "Action": [
                "s3:ListBucket",
                "s3:GetBucketLocation"
            ],
            "Effect": "Allow",
            "Resource": "ARN_OF_YOUR_BUCKET"
        },
        {
            "Sid": "Stmt1719324853778",
            "Action": "s3:*",
            "Effect": "Allow",
            "Resource": "ARN_OF_YOUR_BUCKET/*"
        }
    ]
}
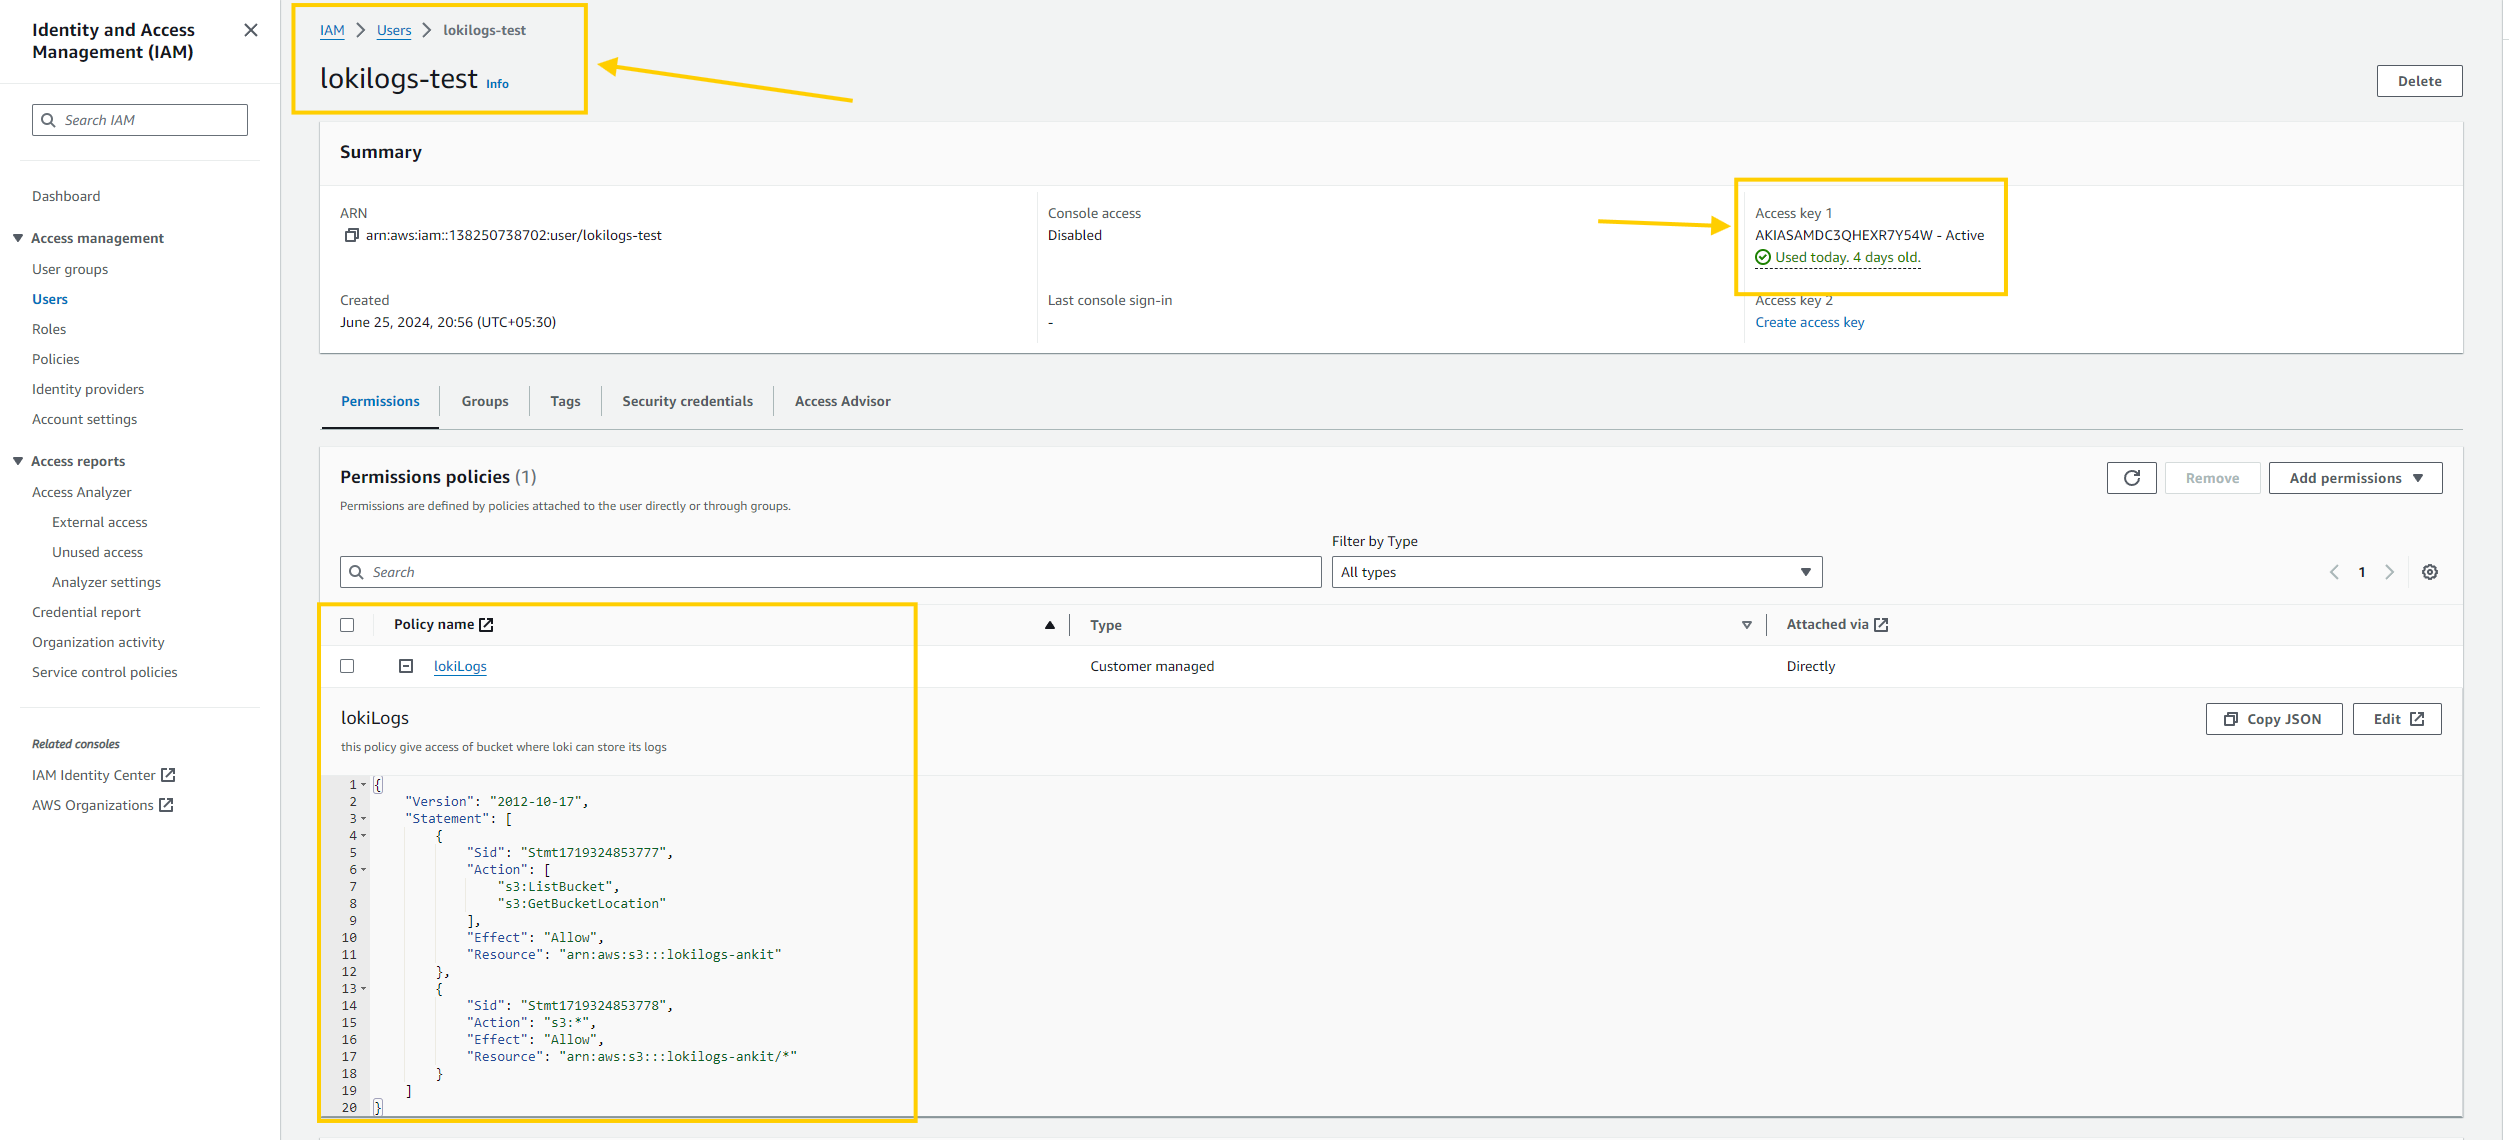
- Lets, ceate an IAM role, attach the policy, and create an
access_key_idandsecret_access_key.
- Now we are ready to configure Loki.
- Let's first see the values.yml file and write that into
loki_distributed_values.yml
helm show values grafana/loki-distributed > loki-promtail-stack/loki_distributed_values.yml
loki_distributed_values.ymlhas all the default settings but we have to make some changes to configure the aws s3 bucket.- for reference, you can see the below screenshots for what values I've changed in the file.
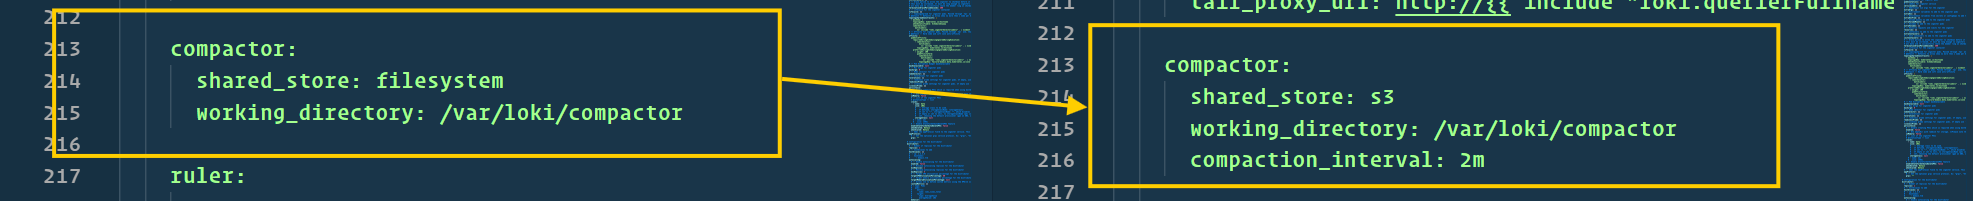
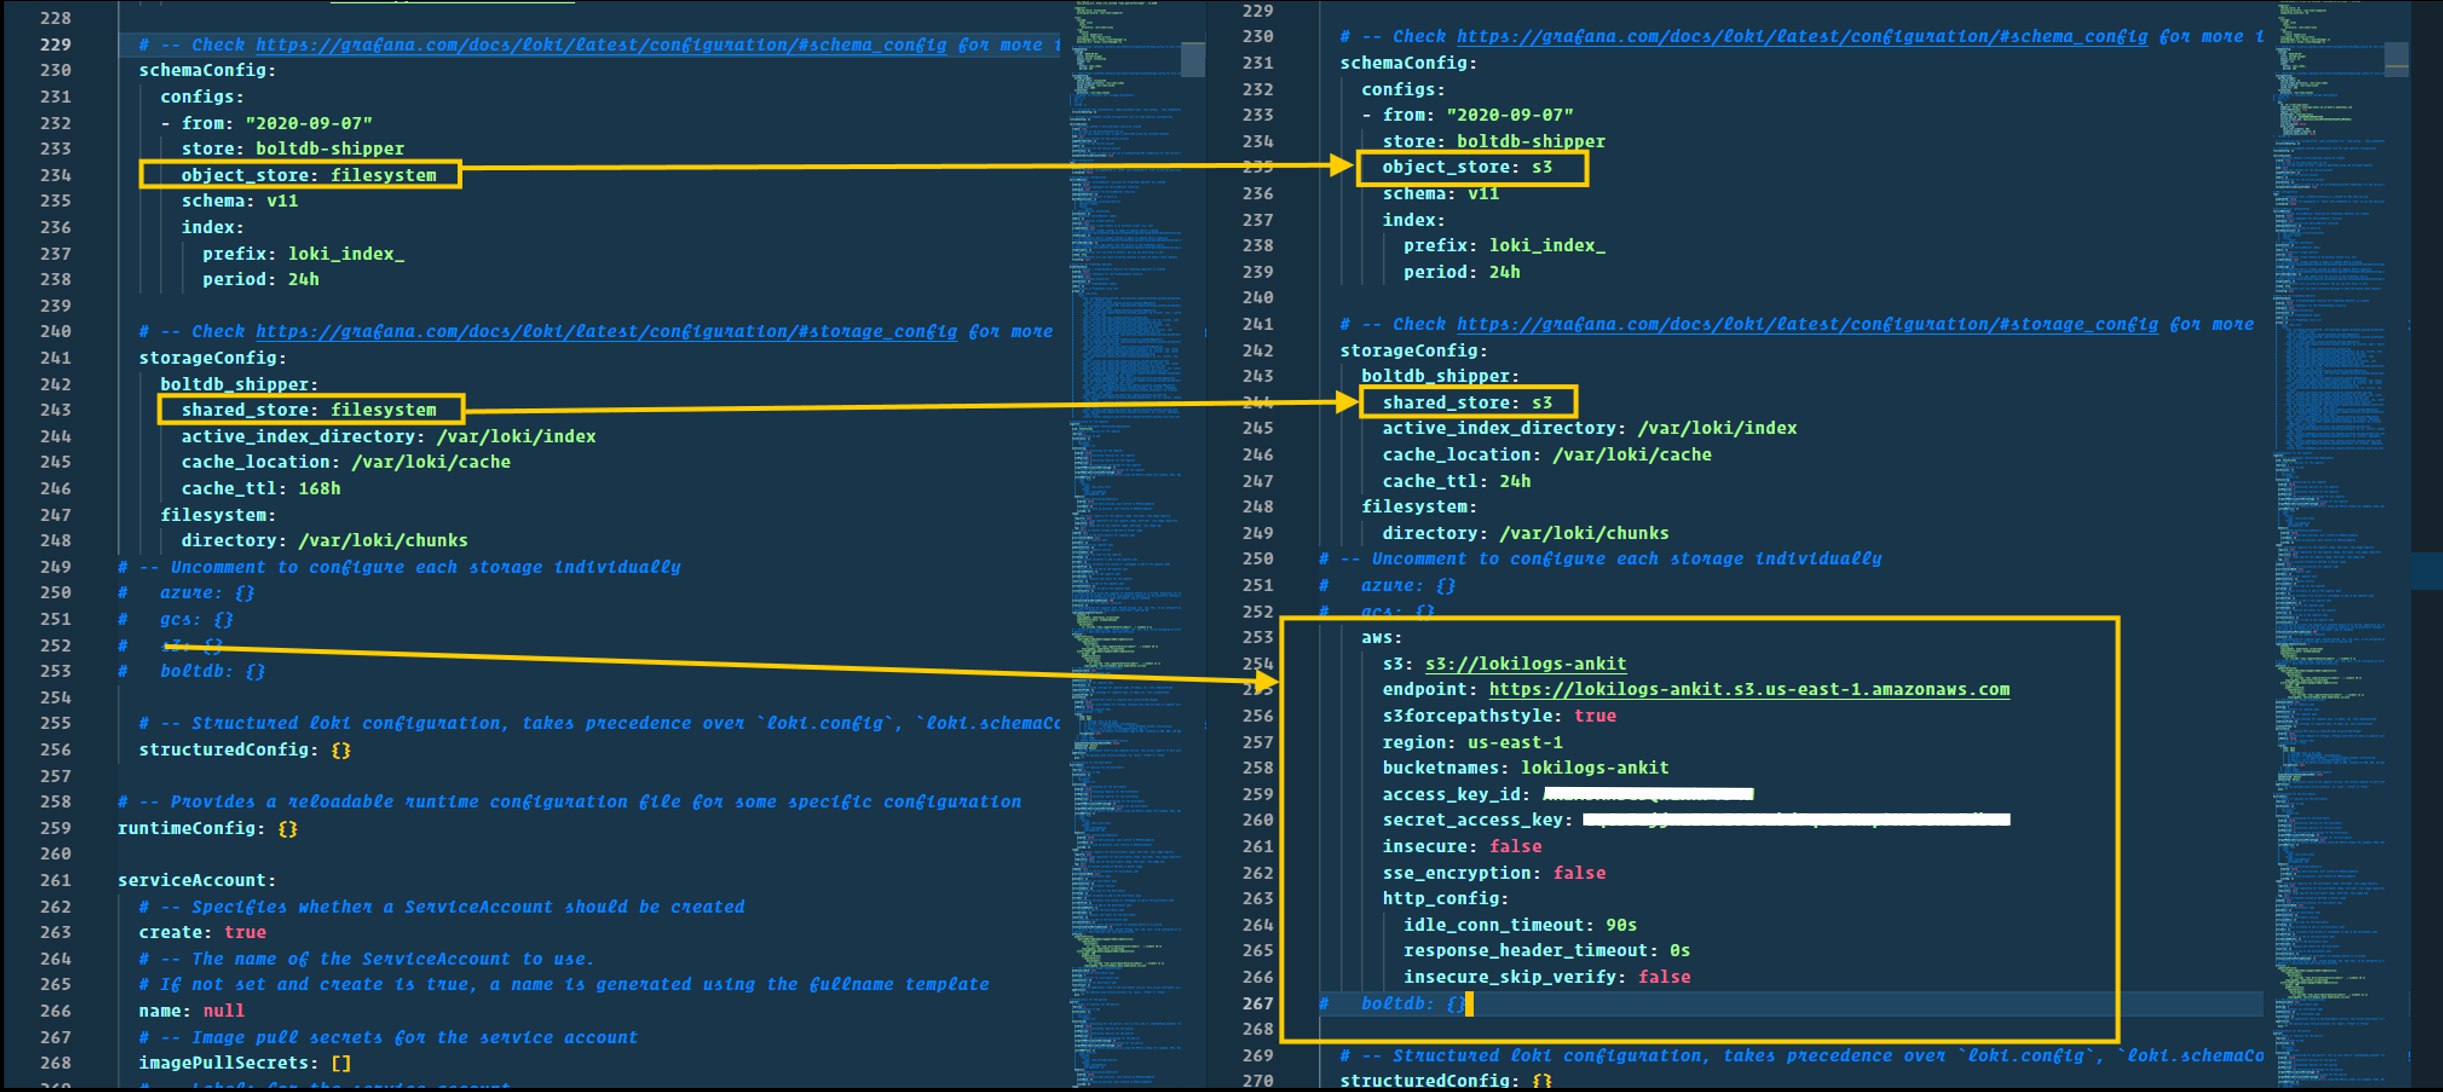
- I also created an updated configuration file,
loki-promtail-stack/custom_loki_distributed_values.yml, with all necessary changes. - Ensure you add your bucket name, region, access ID, and secret access ID.
- Now, let's install Loki on the cluster using the helm chart, hit the below command to install it
helm install loki grafana/loki-distributed -n monitoring -f loki-promtail-stack/custom_loki_distributed_values.yml
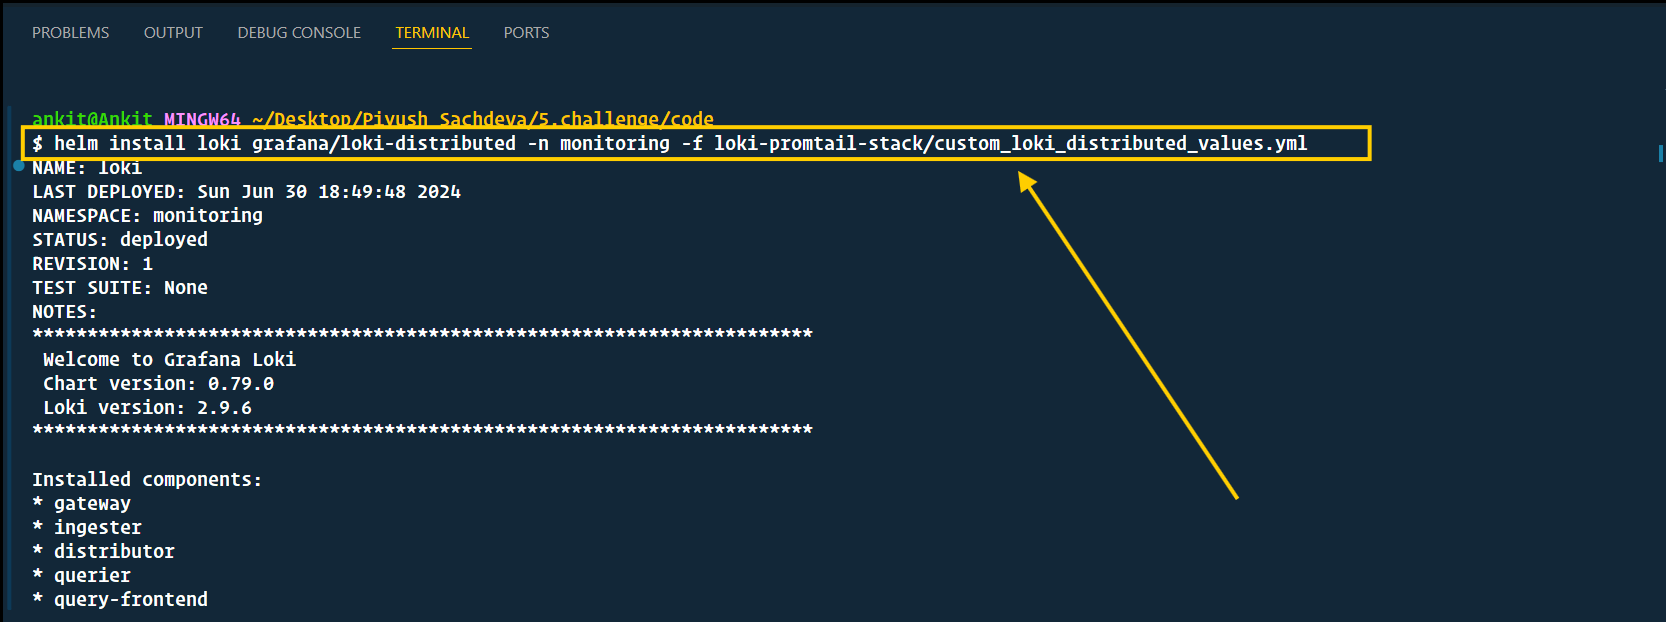
- Yup! We've installed Loki successfully
⚒️ Install & configure Promtail
- Now, let's set up the log collector, Promtail. We already have the Promtail Helm chart in the Grafana repo.
- Since everything is installed in the
monitoringnamespace, we need to change one endpoint in Promtail's default configuration. - Hit the below command to see the default configuration(values.yml) file at
loki-promtail-stack/promtail_values.yml
helm show values grafana/promtail > loki-promtail-stack/promtail_values.yml
- We have to change
clients.urlattribute so Promtail knows where to send the logs. Refer to the image for reference.
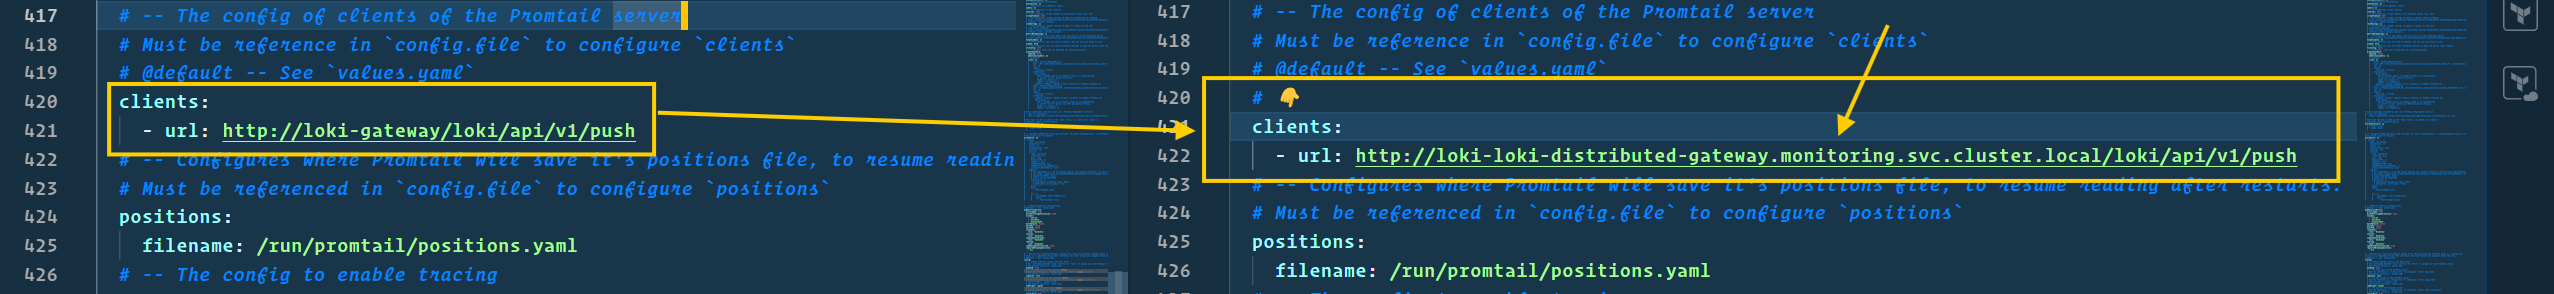
- I also provided an updated configuration file,
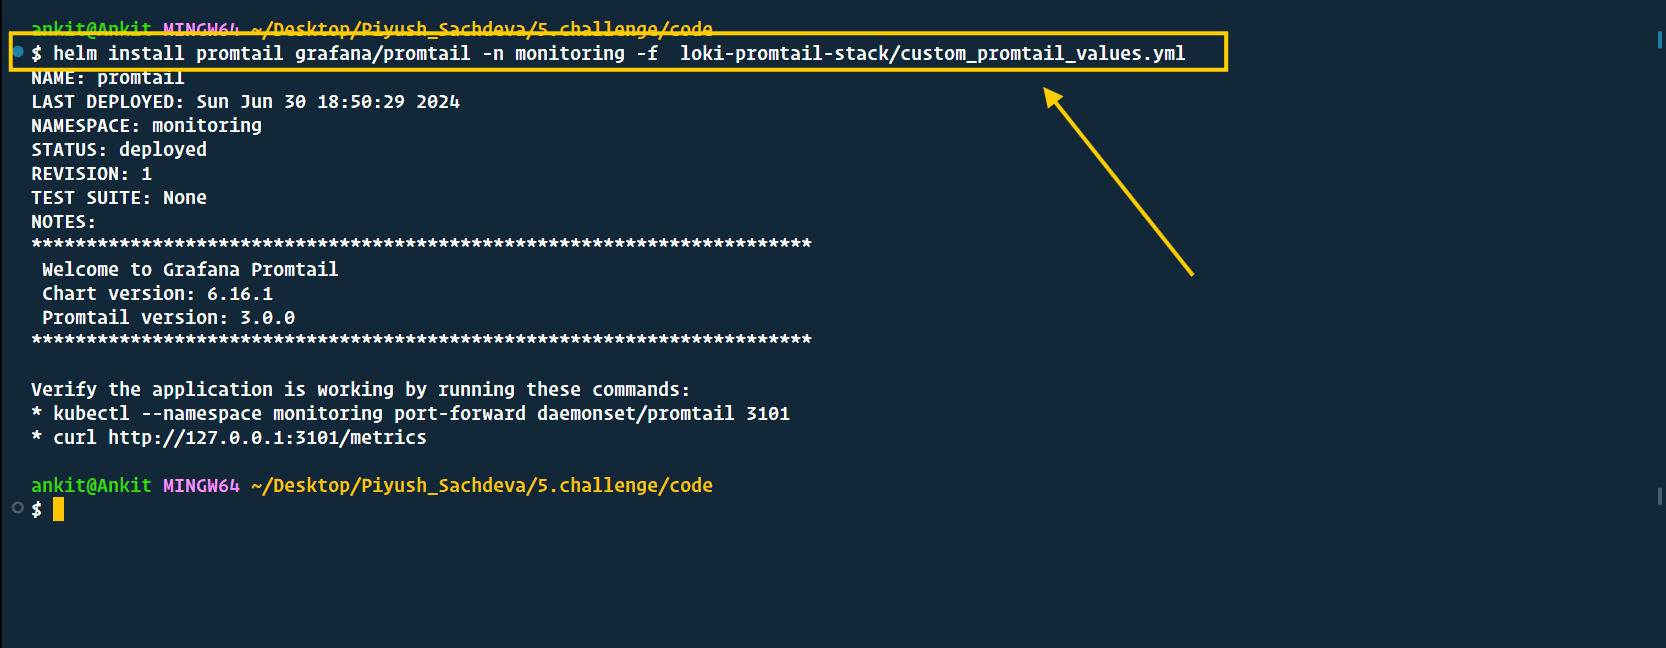
loki-promtail-stack/custom_promtail_values.yml. - Now, we are done with configuration. let's go ahead and install Promtail. please hit the below command
helm install promtail grafana/promtail -n monitoring -f loki-promtail-stack/custom_promtail_values.yml
- Now, let's go ahead and see our logs in the Grafana dashboard. please hit the below command & access grafana at
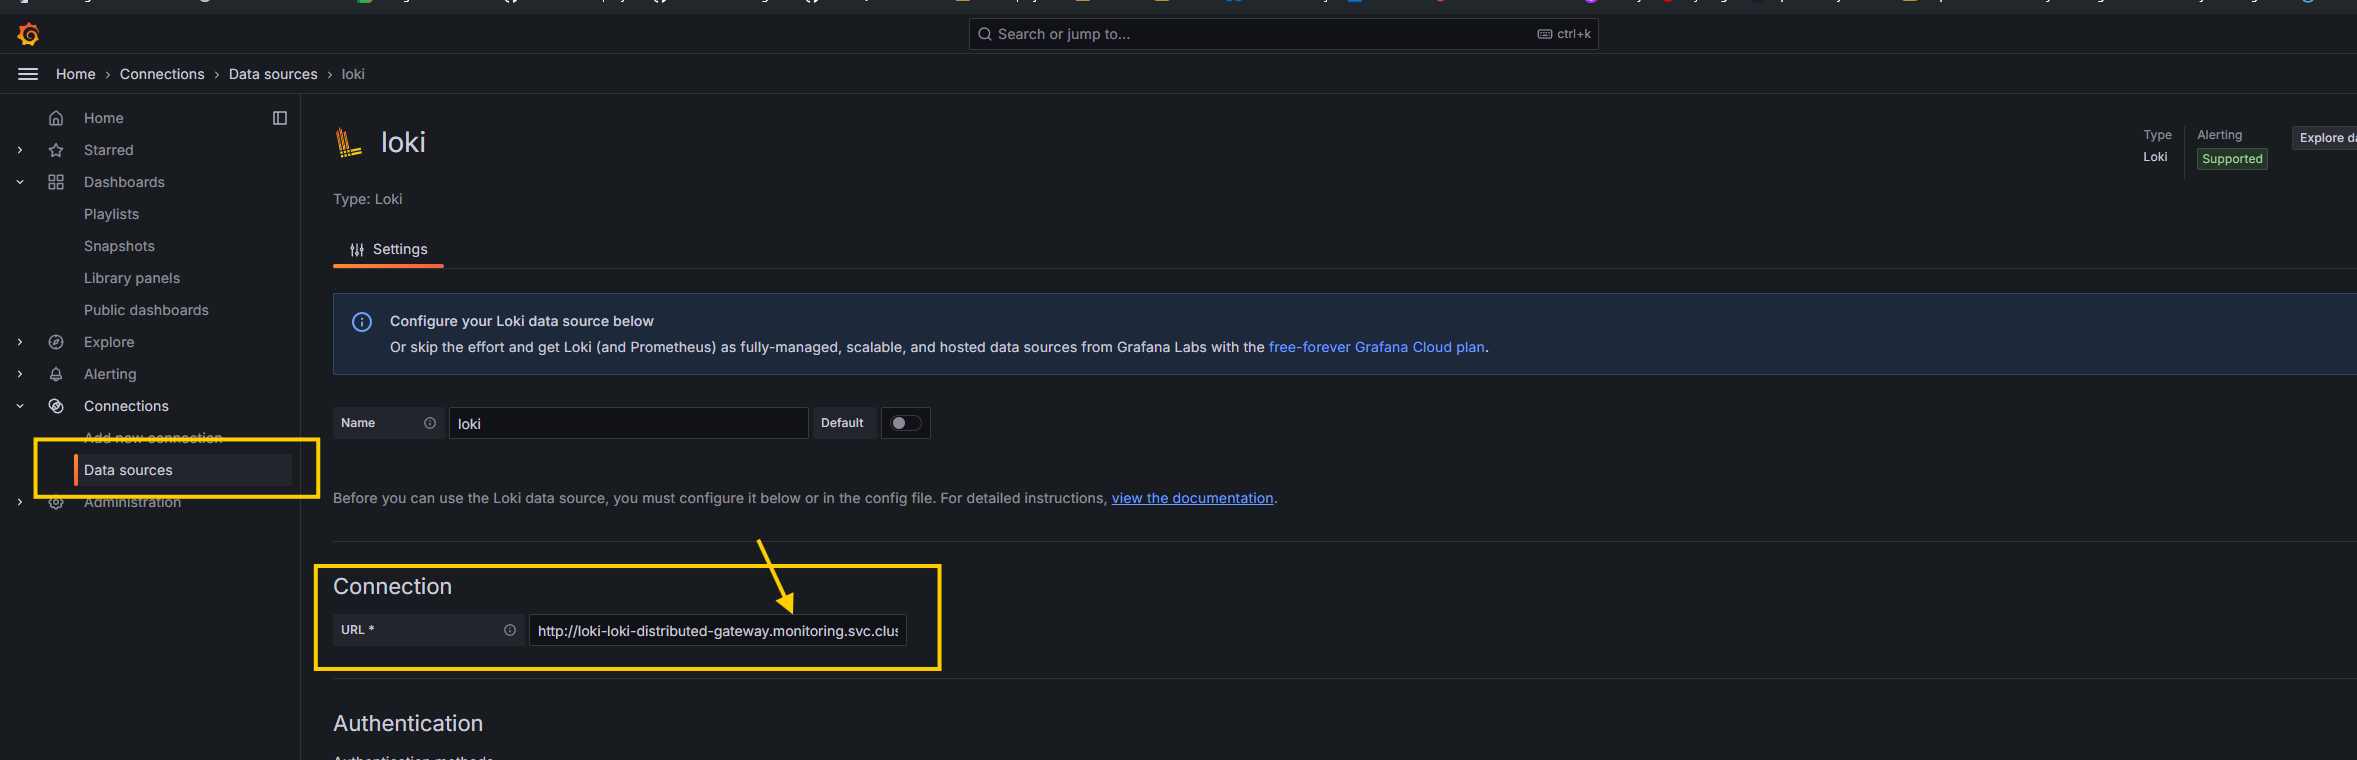
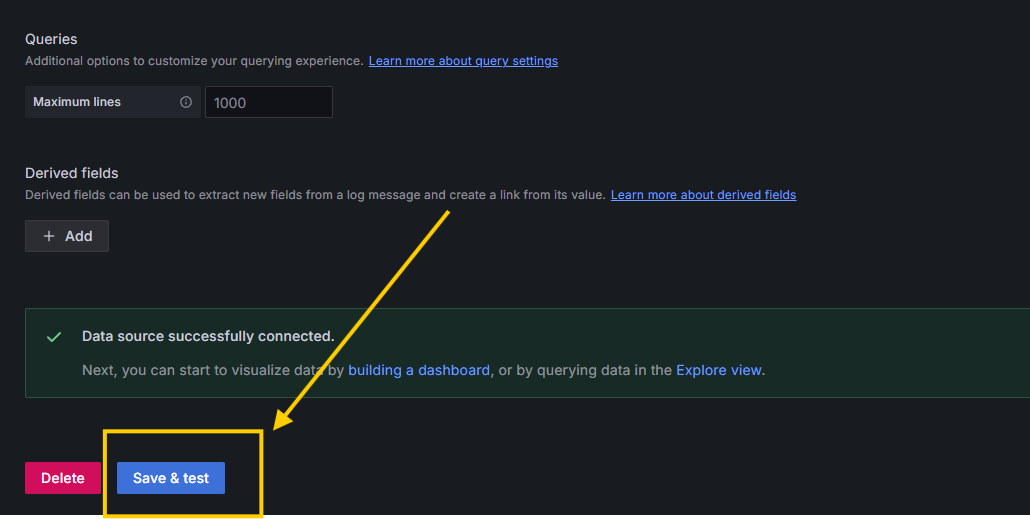
http://localhost:8000 - Before adding a new dashboard, we need to add new data sources so Grafana can query logs from Loki.
- So let's add a new data source. see below image for reference
- Add a new data source with the URL
http://loki-loki-distributed-gateway.monitoring.svc.cluster.local
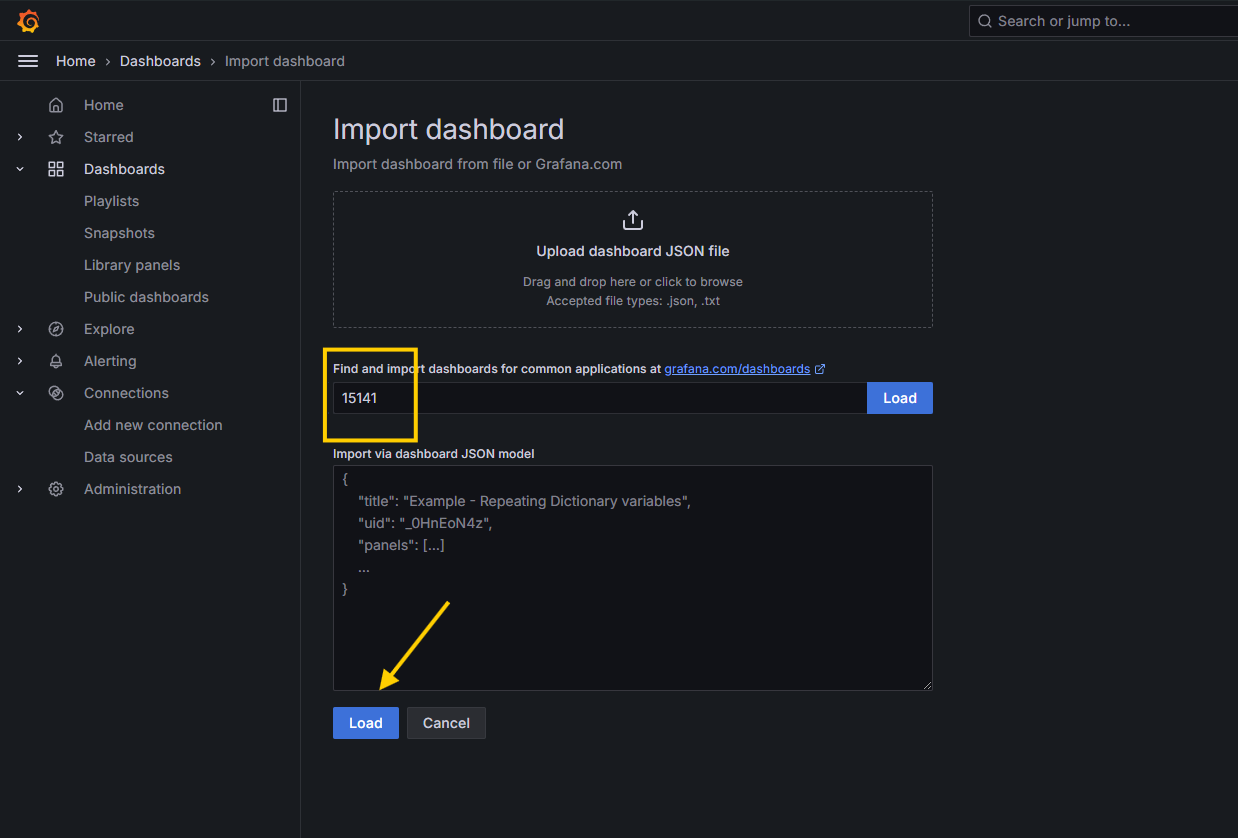
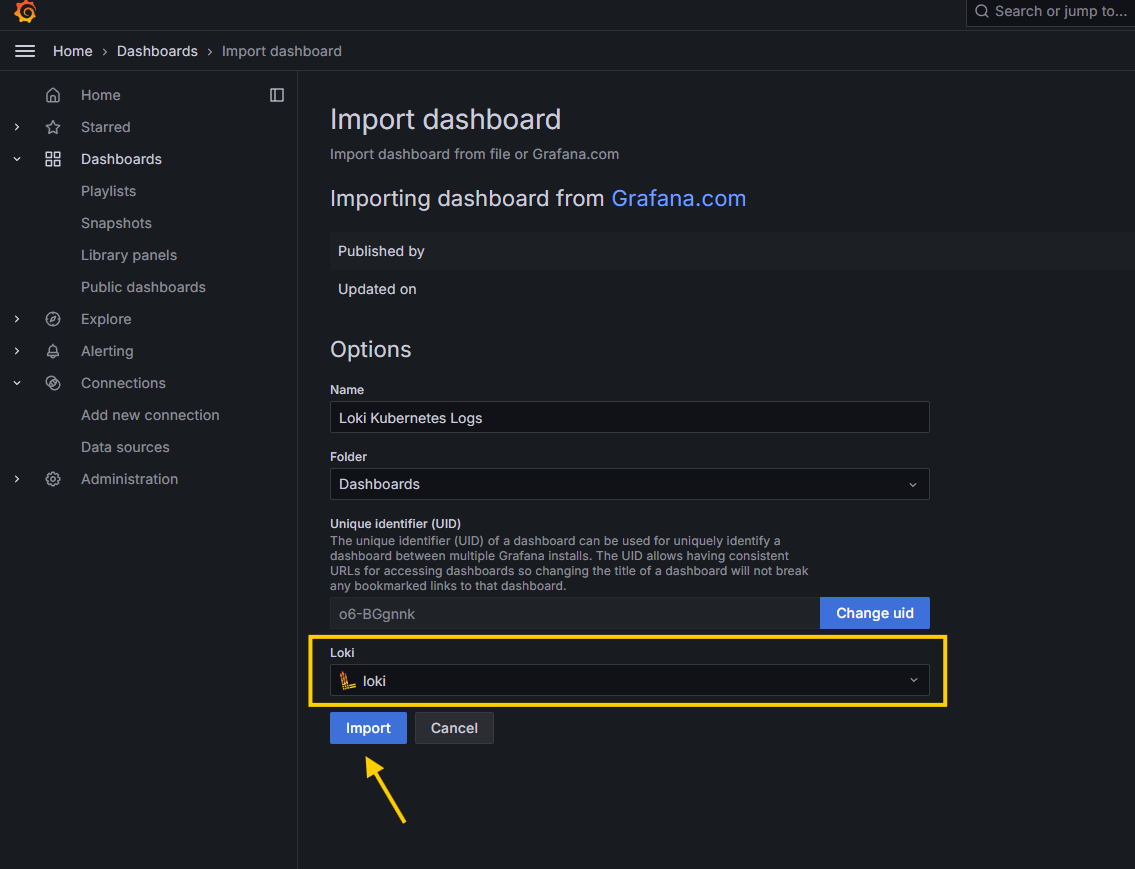
- We've successfully added a data source. Now, import the community dashboard by typing
15414and selecting Loki as the data source.
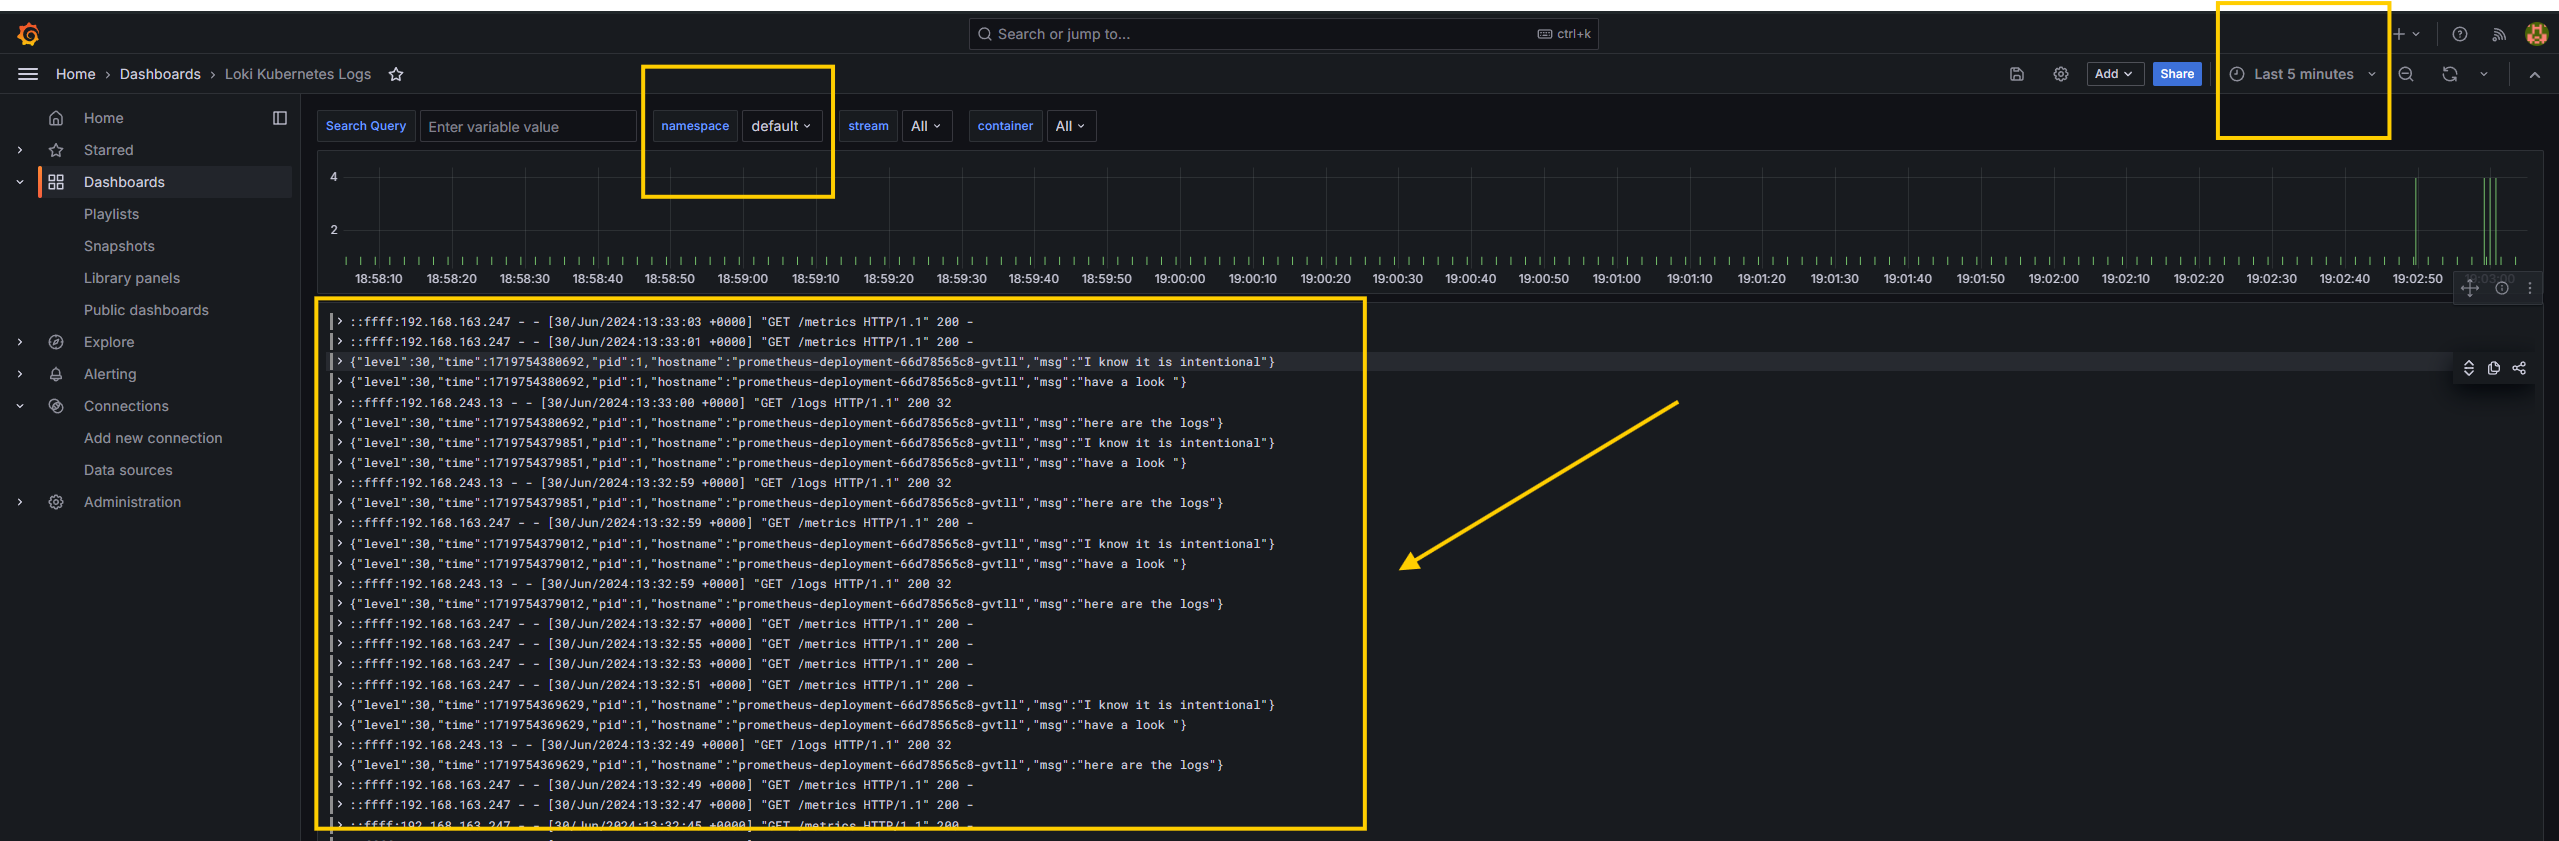
- You can now see all the logs in Grafana. Apply filters to get specific namespace or container logs.
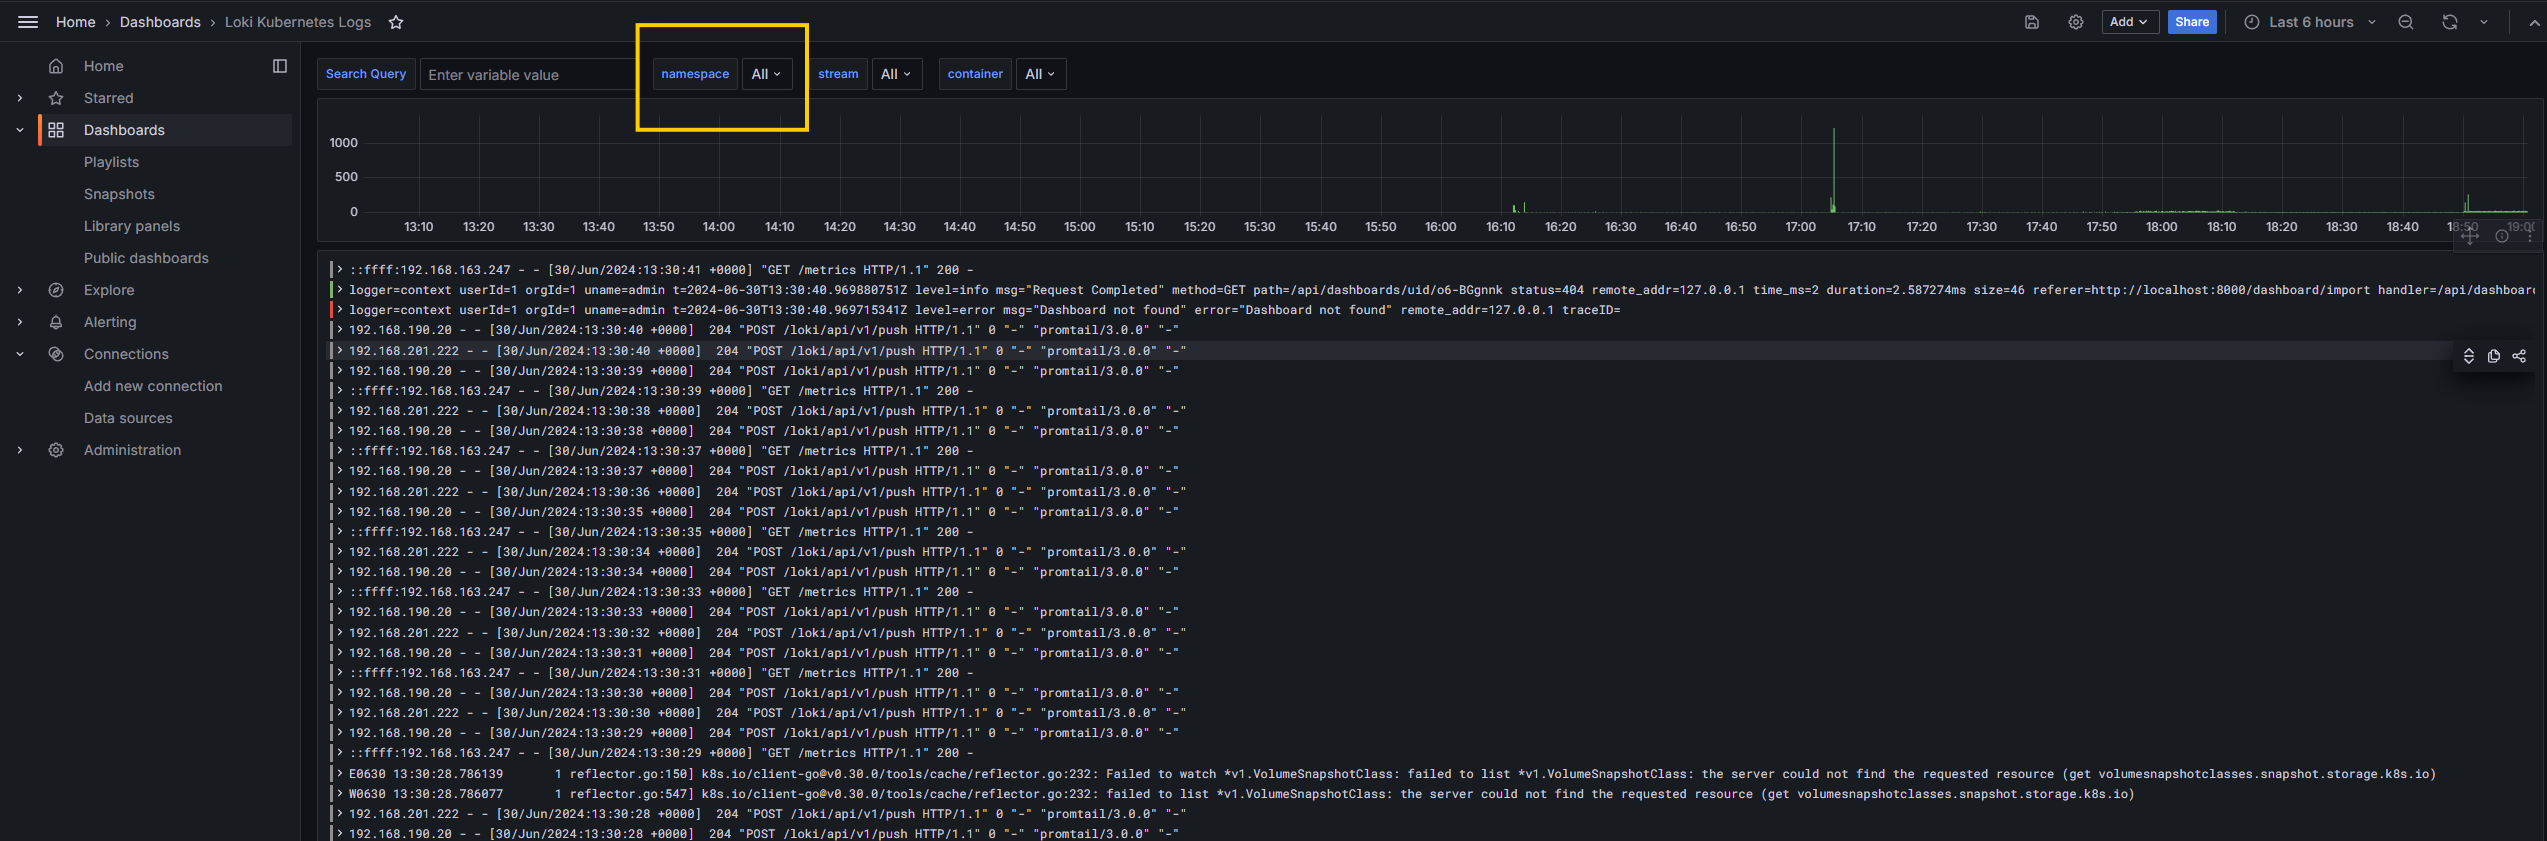
- Now, let's try to generate logs from your application by selecting the
defaultnamespace from the dropdown menu at the top. - You can run that
test.shscript or visithttp://YOUR_LOAD_BALANCER_DNS_NAME/logsin the browser.
- Lastly, verify that Loki is sending logs to the S3 bucket by checking the folders created by Loki in the AWS S3 console.
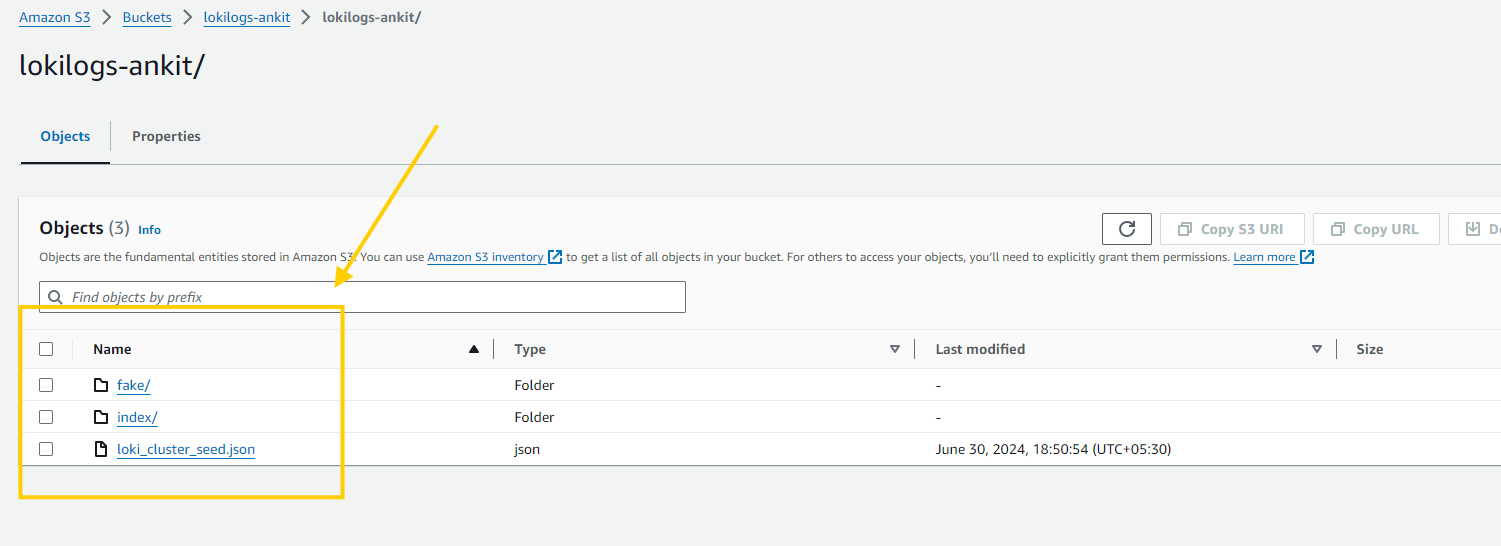
- Yes, we can see the logs are available inside our AWS S3 bucket.
🧼 Cleanup
- It's time to clean up what we've created to avoid unnecessary costs.
- First, delete the Node.js application from Kubernetes:
kubectl delete -k app-k8s-manifest/
- Next, delete the Helm charts installed, as Prometheus, Grafana, and Alertmanager have created AWS EBS volumes:
helm uninstall monitoring -n monitoring

helm uninstall loki -n monitoring

helm uninstall promtail -n monitoring
- Let's even delete the monitoring namespace
kubectl delete ns monitoring
- Also, make sure that we don't have any Persistent volume because if something is left out it will create trouble for Terraform.
kubectl get pv
- Finally, let's destroy our AWS EKS Cluster. so, please navigate to the
eks-terraform/main/directory & hit the below command
cd eks-terraform/main/

terraform destroy --auto-approve
- After executing the above command, you will not have any resources in your AWS account.
🙌 Conclusion
- In this blog, we've comprehensively walked through setting up a monitoring and logging stack on AWS EKS using Prometheus, Grafana, Loki, and Promtail.
- From deploying a Node.js application with custom metrics to visualizing logs and metrics in Grafana, we've covered the entire process step-by-step.
- I aimed to cover all necessary details and best practices. but writing everything in the blog is not possible so I recommend you to dig deeper and check out my Terraform code, Kubernetes manifest files, and the rest of all directories.
- You can implement CICD for Terraform (GitOps approach)
And here it ends... 🙌🥂
if you like my work please message me on LinkedIn with "Hi and your country name"
-🙋♂️ Ankit Jodhani.
📨 reach me at ankitjodhani1903@gmail.com
🎒 Resources
https://github.com/prometheus-community/helm-charts/tree/main/charts/kube-prometheus-stack
https://github.com/grafana/helm-charts/tree/main/charts/loki-distributed
https://github.com/grafana/helm-charts/tree/main/charts/promtail
https://dev.to/aws-builders/monitoring-eks-cluster-with-prometheus-and-grafana-1kpb
https://github.com/grafana/loki/issues/7335
https://stackoverflow.com/questions/76873980/loki-s3-configuration-for-chunks-and-indexes